

[Targeting the right peak of the double top on the higher timeframe] Counter-trend line and mBDSR (RCI two-line filter) selling signal
0
Indicator 【mBDSR】 that captures “tops/bottoms and reversals” in combination with RCI
Methods and case studies (PDF) ★GogoJungle AWARD2020 winner★
https://www.gogojungle.co.jp/tools/indicators/11836
The above products include 301 PDFs (methods, case studies, etc.). For the list of titles of those PDFs, please refer to the article below.
About the 301 PDF files accompanying 【BODSOR・mBDSR】
https://www.gogojungle.co.jp/finance/navi/articles/34271
AUD/JPY 1-hour chart
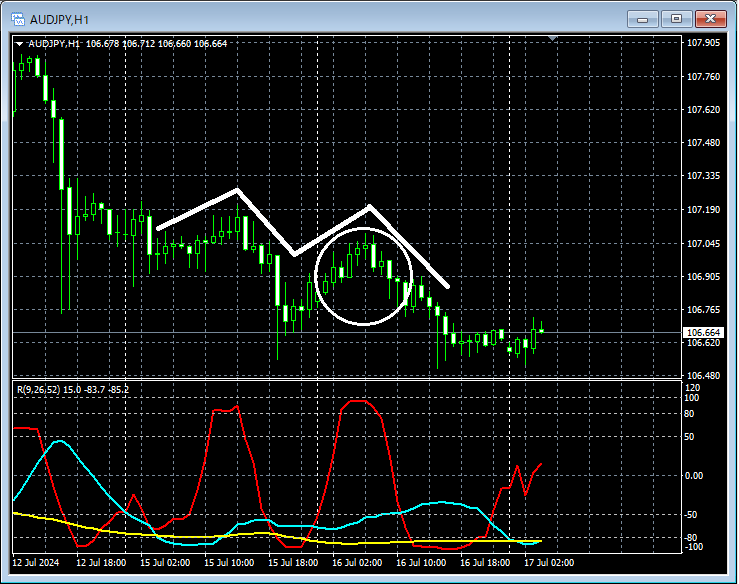
The higher-timeframe chart is omitted, but considering the higher timeframe situation, on the 1-hour chart above,Double topIt is not unusual to expect a drop after forming a double top. Here, we will examine the area circled in white in more detail on a lower timeframe.
AUD/JPY 5-minute chart
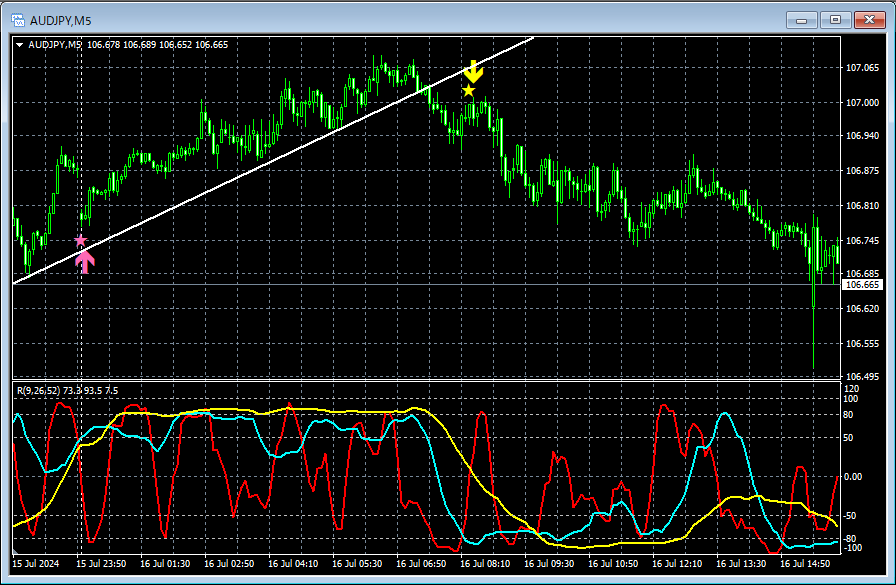
If you monitor the 5-minute chart above,Counter-trend linein the retracement after the breakSignals of mBDSR (two RCI filters)light up and the price declines.
From this example,a trading method that focuses on double tops and counter-trend linesandthe signals of mBDSRshow a high degree of compatibility.
Indicator 【BODSOR・mBDSR】 that powerfully synergizes with RCI
Methods and case studies (PDF) ★GogoJungle AWARD2020 winner★
https://www.gogojungle.co.jp/tools/indicators/11836
The PDF files come with 301 PDFs.
Many of them are designed as examples that logically link higher and lower timeframes using three RCI lines, examining multiple lower timeframes sequentially, and ultimately waiting for pullbacks or rallies on the lower timeframes (i.e., mBDSR signals).They are summarized in this way.
Additionally,many focus on pinpointing points where multiple entry reasons align.
In the explanations,over 1,000 chartsare used.

Methods and case studies (PDF) ★GogoJungle AWARD2020 winner★
https://www.gogojungle.co.jp/tools/indicators/11836
The above products include 301 PDFs (methods, case studies, etc.). For the list of titles of those PDFs, please refer to the article below.
About the 301 PDF files accompanying 【BODSOR・mBDSR】
https://www.gogojungle.co.jp/finance/navi/articles/34271
AUD/JPY 1-hour chart
The higher-timeframe chart is omitted, but considering the higher timeframe situation, on the 1-hour chart above,Double topIt is not unusual to expect a drop after forming a double top. Here, we will examine the area circled in white in more detail on a lower timeframe.
AUD/JPY 5-minute chart
If you monitor the 5-minute chart above,Counter-trend linein the retracement after the breakSignals of mBDSR (two RCI filters)light up and the price declines.
From this example,a trading method that focuses on double tops and counter-trend linesandthe signals of mBDSRshow a high degree of compatibility.
Indicator 【BODSOR・mBDSR】 that powerfully synergizes with RCI
Methods and case studies (PDF) ★GogoJungle AWARD2020 winner★
https://www.gogojungle.co.jp/tools/indicators/11836
The PDF files come with 301 PDFs.
Many of them are designed as examples that logically link higher and lower timeframes using three RCI lines, examining multiple lower timeframes sequentially, and ultimately waiting for pullbacks or rallies on the lower timeframes (i.e., mBDSR signals).They are summarized in this way.
Additionally,many focus on pinpointing points where multiple entry reasons align.
In the explanations,over 1,000 chartsare used.
× ![]()


