

Three figures and mBDSR (RCI2 bandpass filter) short-selling signal
0
Indicator that captures “tops and bottoms and reversals” in combination with RCI 【mBDSR】
Methodology and case studies (PDF) ★GogoJungle AWARD2020 winner★
https://www.gogojungle.co.jp/tools/indicators/11836
The above product includes 301 PDFs (methods, case studies, etc.). For the list of titles of those PDFs, please see the article below.
About the 301 PDF files included with 【BODSOR・mBDSR】
https://www.gogojungle.co.jp/finance/navi/articles/34271
AUDCAD 30-minute chart
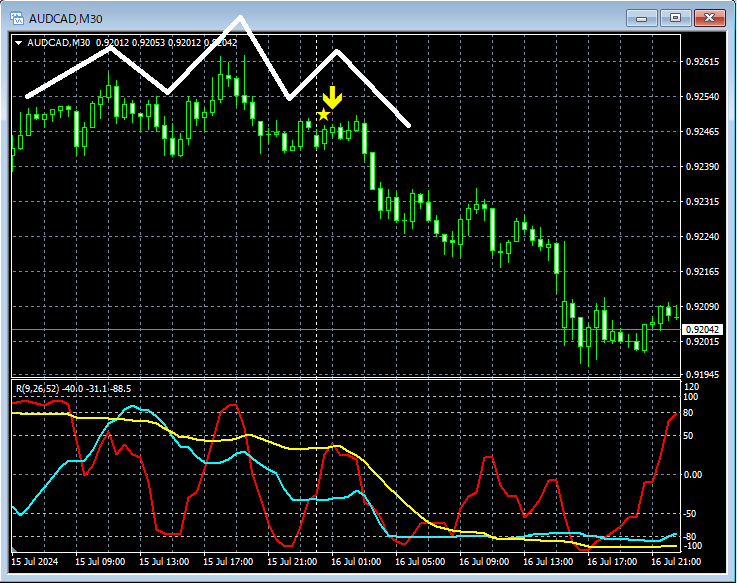
Although the higher-timeframe chart is omitted, the higher timeframe may show a possibility of decline from the resistance zone, and it wouldn’t be surprising to look for a sell-off on the lower timeframe. In the 30-minute chart above,Head and shouldersis formed and price is moving down. In this case,the right shoulder of the head and shouldersnearbymBDSR (2-filter RCI) sell signalis illuminated.
From this example,a trade method focused on head-and-shouldersandthe signal of mBDSRshow high compatibility.
Indicator with strong performance when combined with RCI: 【BODSOR・mBDSR】
Methodology and case studies (PDF) ★GogoJungle AWARD2020 winner★
https://www.gogojungle.co.jp/tools/indicators/11836
The PDF files total 301 (over 1,000 pages, over 350,000 characters).
Many of themdescribe how to logically link higher and lower timeframes using the RCI 3-line setup, sequentially analyzing multiple lower-timeframe situations, and finally waiting for the timing to buy on dips or sell on rallies on the lower timeframe (i.e., the mBDSR signal).This is what they are about.
Additionally,many focus on identifying points where multiple entry reasons overlap..
The explanations usemore than 1,000 charts..

Methodology and case studies (PDF) ★GogoJungle AWARD2020 winner★
https://www.gogojungle.co.jp/tools/indicators/11836
The above product includes 301 PDFs (methods, case studies, etc.). For the list of titles of those PDFs, please see the article below.
About the 301 PDF files included with 【BODSOR・mBDSR】
https://www.gogojungle.co.jp/finance/navi/articles/34271
AUDCAD 30-minute chart
Although the higher-timeframe chart is omitted, the higher timeframe may show a possibility of decline from the resistance zone, and it wouldn’t be surprising to look for a sell-off on the lower timeframe. In the 30-minute chart above,Head and shouldersis formed and price is moving down. In this case,the right shoulder of the head and shouldersnearbymBDSR (2-filter RCI) sell signalis illuminated.
From this example,a trade method focused on head-and-shouldersandthe signal of mBDSRshow high compatibility.
Indicator with strong performance when combined with RCI: 【BODSOR・mBDSR】
Methodology and case studies (PDF) ★GogoJungle AWARD2020 winner★
https://www.gogojungle.co.jp/tools/indicators/11836
The PDF files total 301 (over 1,000 pages, over 350,000 characters).
Many of themdescribe how to logically link higher and lower timeframes using the RCI 3-line setup, sequentially analyzing multiple lower-timeframe situations, and finally waiting for the timing to buy on dips or sell on rallies on the lower timeframe (i.e., the mBDSR signal).This is what they are about.
Additionally,many focus on identifying points where multiple entry reasons overlap..
The explanations usemore than 1,000 charts..
× ![]()


