

Translation (preserving HTML format): The lower-timeframe double top formed on the right-hand peak of the upper-timeframe double top, and the mbDSR (RCI 2-filter) pullback sell signal
0
Indicator that captures “tops and bottoms and reversals” in combination with RCI: 【mBDSR】
and methods and case studies (PDF) ★GogoJungle AWARD2020 winner★
https://www.gogojungle.co.jp/tools/indicators/11836
The above products include 301 PDFs (methods, case studies, etc.). For the list of titles of those PDFs, please see the article below.
About the 301 PDF files included with 【BODSOR・mBDSR】
https://www.gogojungle.co.jp/finance/navi/articles/34271
Pound Swiss, 1-hour chart
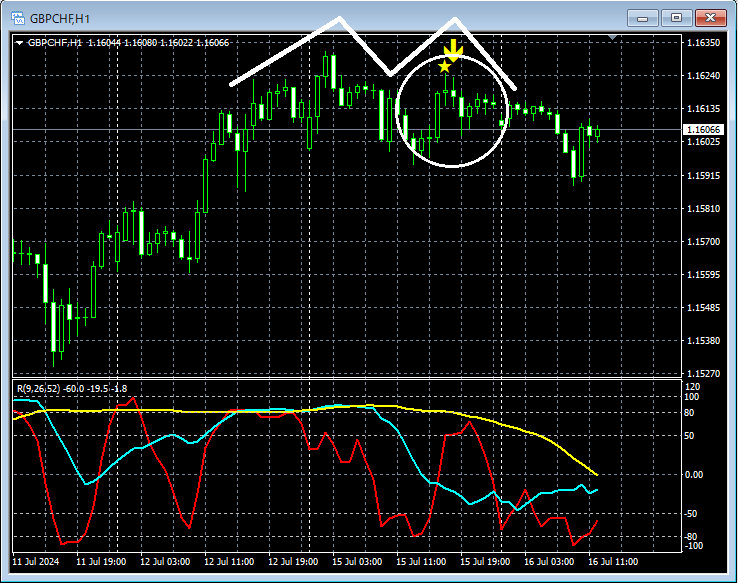
On the 1-hour chart above,the right-side peak of the double topshows a sell signal after a pullback by the mBDSR (two RCI lines filter).
Pound Swiss, 5-minute chart
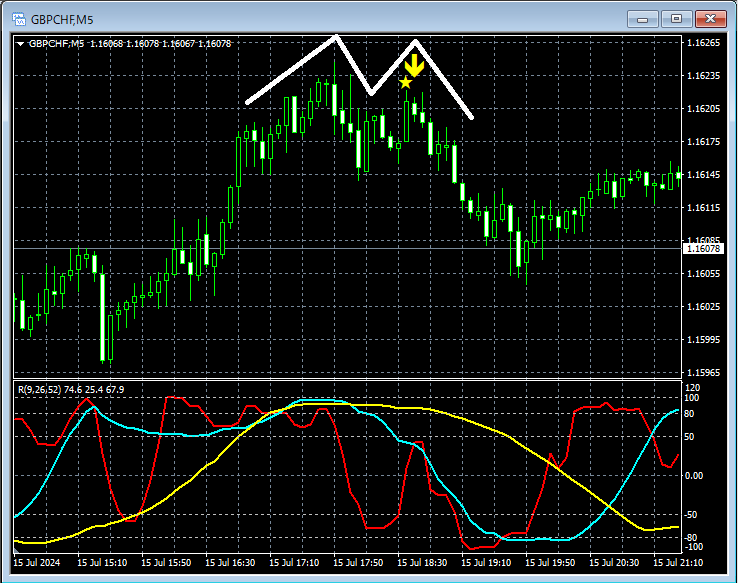
Looking at the 5-minute chart for the movement above, on the 1-hour chartthe right-side peak of the double topforms a 5-minute chartdouble topon the right side of whichthe mBDSR (two RCI lines filter) sell signallights up and the price declines.
From this example,a trading method that focuses on double topsandthe signals of mBDSRshow a high degree of compatibility.
Indicator that shines when combined with RCI: 【BODSOR・mBDSR】
and methods and case studies (PDF) ★GogoJungle AWARD2020 winner★
https://www.gogojungle.co.jp/tools/indicators/11836
A total of 301 PDF files are included.
Many of them are about logically linking higher and lower timeframes using three RCI lines, examining multiple lower timeframes step by step, and ultimately waiting for timing on lower timeframes for buying dips or selling rallies (i.e., signals of mBDSR).
Additionally,many focus on identifying points where multiple entry reasons overlap.
The explanations useover 1,000 charts.

and methods and case studies (PDF) ★GogoJungle AWARD2020 winner★
https://www.gogojungle.co.jp/tools/indicators/11836
The above products include 301 PDFs (methods, case studies, etc.). For the list of titles of those PDFs, please see the article below.
About the 301 PDF files included with 【BODSOR・mBDSR】
https://www.gogojungle.co.jp/finance/navi/articles/34271
Pound Swiss, 1-hour chart
On the 1-hour chart above,the right-side peak of the double topshows a sell signal after a pullback by the mBDSR (two RCI lines filter).
Pound Swiss, 5-minute chart
Looking at the 5-minute chart for the movement above, on the 1-hour chartthe right-side peak of the double topforms a 5-minute chartdouble topon the right side of whichthe mBDSR (two RCI lines filter) sell signallights up and the price declines.
From this example,a trading method that focuses on double topsandthe signals of mBDSRshow a high degree of compatibility.
Indicator that shines when combined with RCI: 【BODSOR・mBDSR】
and methods and case studies (PDF) ★GogoJungle AWARD2020 winner★
https://www.gogojungle.co.jp/tools/indicators/11836
A total of 301 PDF files are included.
Many of them are about logically linking higher and lower timeframes using three RCI lines, examining multiple lower timeframes step by step, and ultimately waiting for timing on lower timeframes for buying dips or selling rallies (i.e., signals of mBDSR).
Additionally,many focus on identifying points where multiple entry reasons overlap.
The explanations useover 1,000 charts.
× ![]()


