

[Trade focused on the previous low] mBDSR (RCI 2-line filter) pullback buying signal
0
Indicator to Capture Tailing Bottom and Reversal in Combination with RCI: 【mBDSR】
Methods and Case Studies (PDF) ★GogoJungle AWARD2020 Winner★
https://www.gogojungle.co.jp/tools/indicators/11836
The above products include 301 PDFs (methods, case studies, etc.). For a list of the titles of those PDFs, please refer to the article below.
About the 301 PDF files included with 【BODSOR・mBDSR】
https://www.gogojungle.co.jp/finance/navi/articles/34271
NZDUSD 5-minute chart
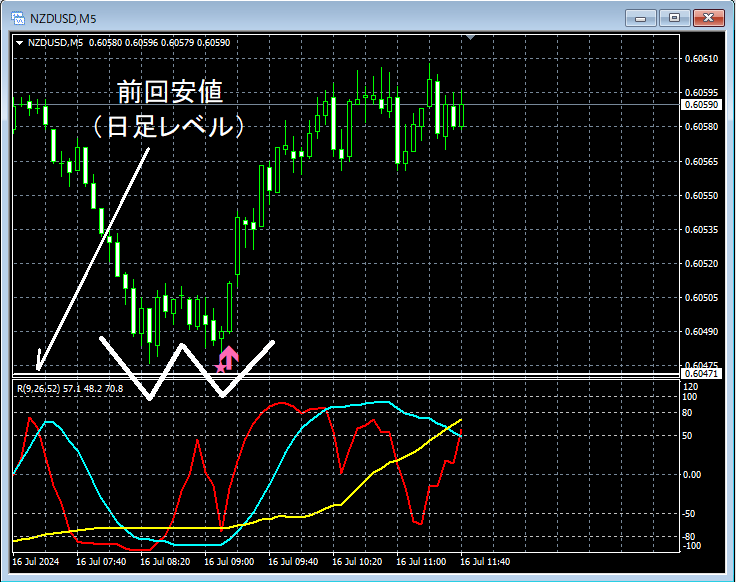
On the 5-minute chart above,the price has fallen toward the previous daily lowaround that levelforming a double bottomand rising. Thedouble bottomshows a timelymBDSR (filters: RCI26 and RCI52)buy-the-dip signal lights up at the right-side valley of the double bottom.
From this example,a trading method focusing on notable lows on higher timeframesandthe signal of mBDSRshow high compatibility.
Additionally, in this example, placing the stop slightly belowthe low of the left valley of the double bottomallows for a favorable risk-reward trade.
An indicator that shines in combination with RCI: 【BODSOR・mBDSR】
Methods and Case Studies (PDF) ★GogoJungle AWARD2020 Winner★
https://www.gogojungle.co.jp/tools/indicators/11836
There are 283 PDF files included.
Many of them summarize examples that logically link higher and lower timeframes by using three RCI lines, progressively considering the situations across multiple lower timeframes, and ultimately waiting for pullbacks or retracements timing (=mBDSR signals) on the lower timeframe.
Also,many focus on identifying points where multiple entry reasons overlap.
In the explanations,there are over 1,000 charts used.

Methods and Case Studies (PDF) ★GogoJungle AWARD2020 Winner★
https://www.gogojungle.co.jp/tools/indicators/11836
The above products include 301 PDFs (methods, case studies, etc.). For a list of the titles of those PDFs, please refer to the article below.
About the 301 PDF files included with 【BODSOR・mBDSR】
https://www.gogojungle.co.jp/finance/navi/articles/34271
NZDUSD 5-minute chart
On the 5-minute chart above,the price has fallen toward the previous daily lowaround that levelforming a double bottomand rising. Thedouble bottomshows a timelymBDSR (filters: RCI26 and RCI52)buy-the-dip signal lights up at the right-side valley of the double bottom.
From this example,a trading method focusing on notable lows on higher timeframesandthe signal of mBDSRshow high compatibility.
Additionally, in this example, placing the stop slightly belowthe low of the left valley of the double bottomallows for a favorable risk-reward trade.
An indicator that shines in combination with RCI: 【BODSOR・mBDSR】
Methods and Case Studies (PDF) ★GogoJungle AWARD2020 Winner★
https://www.gogojungle.co.jp/tools/indicators/11836
There are 283 PDF files included.
Many of them summarize examples that logically link higher and lower timeframes by using three RCI lines, progressively considering the situations across multiple lower timeframes, and ultimately waiting for pullbacks or retracements timing (=mBDSR signals) on the lower timeframe.
Also,many focus on identifying points where multiple entry reasons overlap.
In the explanations,there are over 1,000 charts used.
× ![]()


