

[Bitcoin] mBDSR (RCI2 two-filter) Signal Example - From Yesterday's Chart -
0
Indicator that captures the tops and bottoms and reversals in combination with RCI: "mBDSR"
Method and case studies (PDF) ★GogoJungle AWARD2020 Winner★
https://www.gogojungle.co.jp/tools/indicators/11836
The above products include 301 PDFs (methods, case studies, etc.). For a list of the titles of those PDFs, please see the article below.
About the 301 PDF files included with 【BODSOR・mBDSR】
https://www.gogojungle.co.jp/finance/navi/articles/34271
BTCUSD Bitcoin / US Dollar 5-minute chart
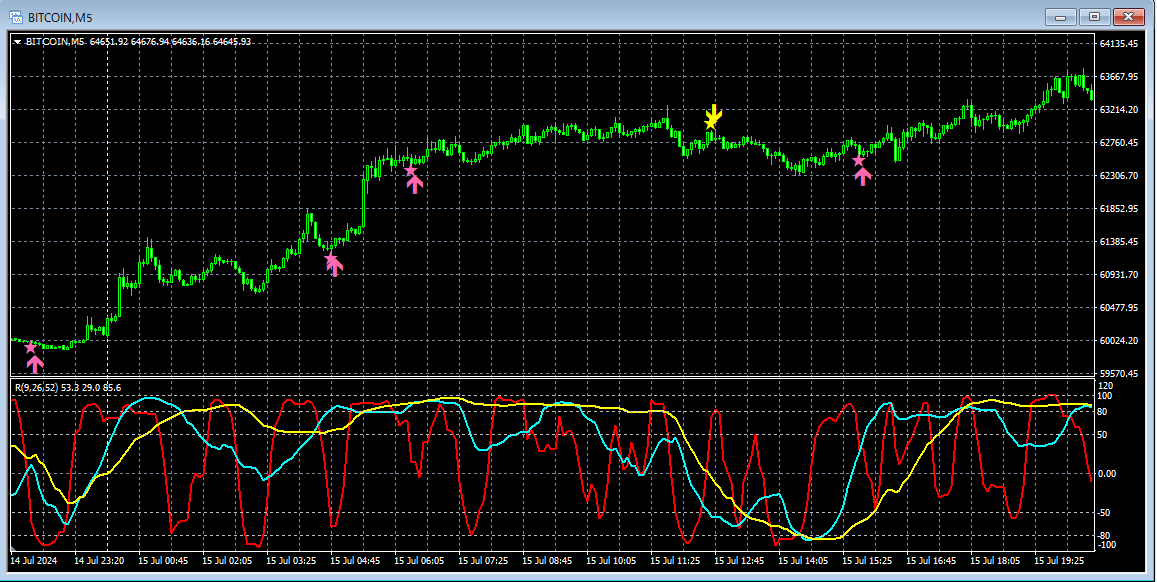
The arrow signals on the 5-minute chart above are,mBDSR (filter: RCI26 and RCI52)the buy-the-dip and sell-the-rally signals.
Indicator that shines in combination with RCI: 【BODSOR・mBDSR】
Method and case studies (PDF) ★GogoJungle AWARD2020 Winner★
https://www.gogojungle.co.jp/tools/indicators/11836
The PDF files include 301 items.
Many of them are about logically linking higher and lower timeframes using three RCI lines to examine multiple lower timeframes sequentially, ultimately waiting for pullback buys or pullback sells on the lower timeframes (the mBDSR signals).many focus on identifying points where multiple entry criteria overlap.That is,
They also emphasize such overlapping-entry points.
The explanations usemore than 1,000 charts in total..

Method and case studies (PDF) ★GogoJungle AWARD2020 Winner★
https://www.gogojungle.co.jp/tools/indicators/11836
The above products include 301 PDFs (methods, case studies, etc.). For a list of the titles of those PDFs, please see the article below.
About the 301 PDF files included with 【BODSOR・mBDSR】
https://www.gogojungle.co.jp/finance/navi/articles/34271
BTCUSD Bitcoin / US Dollar 5-minute chart
The arrow signals on the 5-minute chart above are,mBDSR (filter: RCI26 and RCI52)the buy-the-dip and sell-the-rally signals.
Indicator that shines in combination with RCI: 【BODSOR・mBDSR】
Method and case studies (PDF) ★GogoJungle AWARD2020 Winner★
https://www.gogojungle.co.jp/tools/indicators/11836
The PDF files include 301 items.
Many of them are about logically linking higher and lower timeframes using three RCI lines to examine multiple lower timeframes sequentially, ultimately waiting for pullback buys or pullback sells on the lower timeframes (the mBDSR signals).many focus on identifying points where multiple entry criteria overlap.That is,
They also emphasize such overlapping-entry points.
The explanations usemore than 1,000 charts in total..
× ![]()


