

[mBDSR (RCI2 本フィルター) usage example] Signs of rebound near the moving average line that is prioritized
Indicator that captures “top-bottom reversal” in combination with RCI【mBDSR】
method and case studies (PDF) ★GogoJungle AWARD2020 winner★
https://www.gogojungle.co.jp/tools/indicators/11836
The above products include 301 PDFs (methods, case studies, etc.). For a list of the PDF titles, please refer to the article below.
About the 301 PDF files included with 【BODSOR・mBDSR】
https://www.gogojungle.co.jp/finance/navi/articles/34271
Pound Canadian Dollar 5-minute chart
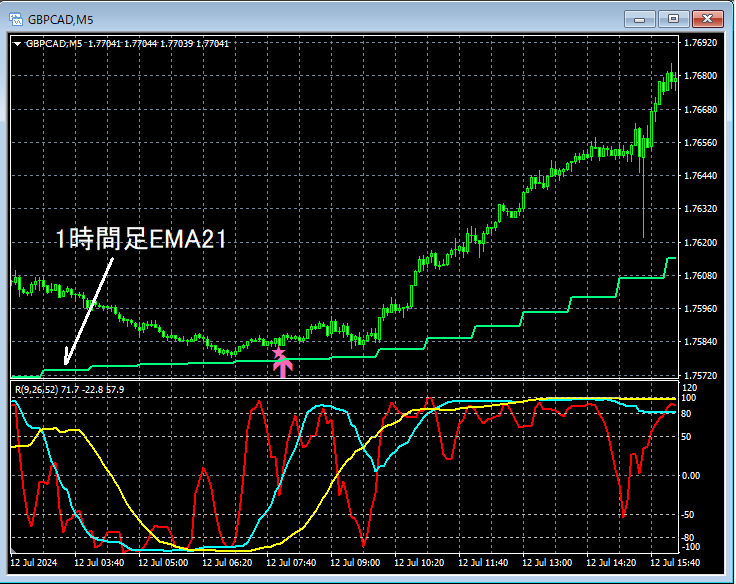
I will omit the higher-timeframe charts, but considering the higher-timeframe context, it may not be strange to look for pullbacks. Look for signs of rebound near the moving averages that are being emphasized. In this example,around the 1-hour EMA21nearby,mBDSR (filter: RCI26 and RCI52) pullback-buy signallights up and the price rises significantly.
From this example,a trading method that focuses on rebounds at moving averagesandthe signals of mBDSRshow a high degree of compatibility.
Additionally, in this example, by placing the stop-loss slightly below the recent low,a trade with good risk-reward can be achieved.
Indicator that shines when combined with RCI: 【BODSOR・mBDSR】
method and case studies (PDF) ★GogoJungle AWARD2020 winner★
https://www.gogojungle.co.jp/tools/indicators/11836
The PDF files amount to 301 documents (over 1,000 pages, over 350,000 characters in total).
Many of them are the ones that describe a process of logically linking higher and lower timeframes using the RCI three-line setup, and ultimately breaking down into considering the conditions for pullbacks or pullbacks timing on lower timeframes (i.e., the mBDSR signals).This is what is summarized.
Also,there are many that focus on capturing points where multiple entry reasons overlap.Also,
The explanations usemore than 1,000 chartsin total.

method and case studies (PDF) ★GogoJungle AWARD2020 winner★
https://www.gogojungle.co.jp/tools/indicators/11836
The above products include 301 PDFs (methods, case studies, etc.). For a list of the PDF titles, please refer to the article below.
About the 301 PDF files included with 【BODSOR・mBDSR】
https://www.gogojungle.co.jp/finance/navi/articles/34271
Pound Canadian Dollar 5-minute chart
I will omit the higher-timeframe charts, but considering the higher-timeframe context, it may not be strange to look for pullbacks. Look for signs of rebound near the moving averages that are being emphasized. In this example,around the 1-hour EMA21nearby,mBDSR (filter: RCI26 and RCI52) pullback-buy signallights up and the price rises significantly.
From this example,a trading method that focuses on rebounds at moving averagesandthe signals of mBDSRshow a high degree of compatibility.
Additionally, in this example, by placing the stop-loss slightly below the recent low,a trade with good risk-reward can be achieved.
Indicator that shines when combined with RCI: 【BODSOR・mBDSR】
method and case studies (PDF) ★GogoJungle AWARD2020 winner★
https://www.gogojungle.co.jp/tools/indicators/11836
The PDF files amount to 301 documents (over 1,000 pages, over 350,000 characters in total).
Many of them are the ones that describe a process of logically linking higher and lower timeframes using the RCI three-line setup, and ultimately breaking down into considering the conditions for pullbacks or pullbacks timing on lower timeframes (i.e., the mBDSR signals).This is what is summarized.
Also,there are many that focus on capturing points where multiple entry reasons overlap.Also,
The explanations usemore than 1,000 chartsin total.
× ![]()


