

【mBDSR (RCI2本フィルター) のサイン】 Trade focusing on notable past highs
0
Indicator "Capture Bottoms and Reversals" when combined with RCI: mBDSR
Methods and Case Studies (PDF) ★GogoJungle AWARD2020 Recipient★
https://www.gogojungle.co.jp/tools/indicators/11836
This product includes 301 PDFs (techniques, case studies, etc.). For a list of the PDF titles, please see the article below.
About the 301 PDF files included with 【BODSOR・mBDSR】
https://www.gogojungle.co.jp/finance/navi/articles/34271
Pound/Swiss Franc 30-minute chart
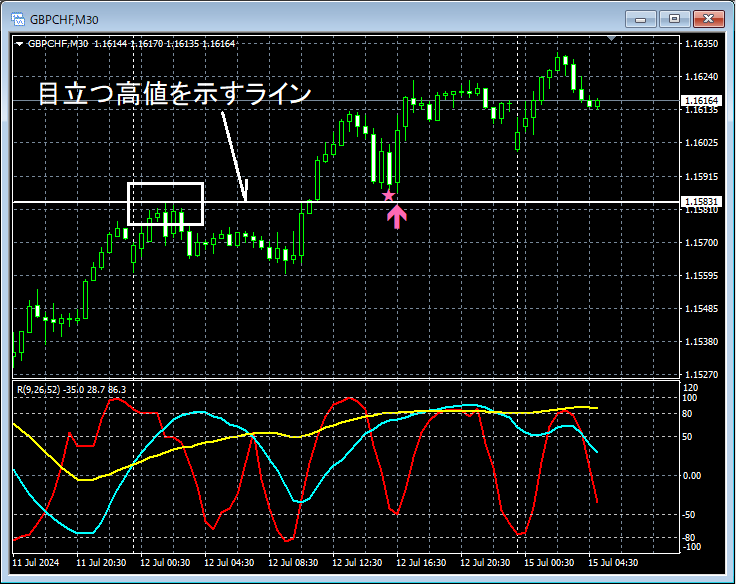
On the 30-minute chart above,near a past notable highthe price has pulled back to a vicinity wheremBDSR (Filter: RCI26 and RCI52)buy-the-dip signal lights up and the price rises sharply.
From this example,a trading method focused on past notable highsandthe signals of mBDSRshow a strong compatibility.
Indicator that shines when combined with RCI: 【BODSOR・mBDSR】
Methods and Case Studies (PDF) ★GogoJungle AWARD2020 Recipient★
https://www.gogojungle.co.jp/tools/indicators/11836
There are 283 PDF files included.
Many of them are summaries of examples that logically link the higher and lower timeframes by using three RCI lines, examining multiple lower timeframes step by step, and ultimately waiting for pullbacks (or retracements) timing on the lower timeframes (i.e., mBDSR signals).This is what it consists of.
Additionally,there are many that emphasize identifying points where multiple entry reasons overlap..
The explanations useover 1,000 charts in total.

Methods and Case Studies (PDF) ★GogoJungle AWARD2020 Recipient★
https://www.gogojungle.co.jp/tools/indicators/11836
This product includes 301 PDFs (techniques, case studies, etc.). For a list of the PDF titles, please see the article below.
About the 301 PDF files included with 【BODSOR・mBDSR】
https://www.gogojungle.co.jp/finance/navi/articles/34271
Pound/Swiss Franc 30-minute chart
On the 30-minute chart above,near a past notable highthe price has pulled back to a vicinity wheremBDSR (Filter: RCI26 and RCI52)buy-the-dip signal lights up and the price rises sharply.
From this example,a trading method focused on past notable highsandthe signals of mBDSRshow a strong compatibility.
Indicator that shines when combined with RCI: 【BODSOR・mBDSR】
Methods and Case Studies (PDF) ★GogoJungle AWARD2020 Recipient★
https://www.gogojungle.co.jp/tools/indicators/11836
There are 283 PDF files included.
Many of them are summaries of examples that logically link the higher and lower timeframes by using three RCI lines, examining multiple lower timeframes step by step, and ultimately waiting for pullbacks (or retracements) timing on the lower timeframes (i.e., mBDSR signals).This is what it consists of.
Additionally,there are many that emphasize identifying points where multiple entry reasons overlap..
The explanations useover 1,000 charts in total.
× ![]()


