

Looking for signs of a rebound near the moving average line that is being prioritized【Example of using mBDSR (RCI two-filter)】
0
Indicator “Capturing Tops and Bottoms/Breaks” in combination with RCI: [mBDSR]
Methods and Case Studies (PDF) ★GogoJungle AWARD2020 winner★
https://www.gogojungle.co.jp/tools/indicators/11836
The above products include 301 PDFs (methods, case studies, etc.). For a list of the PDF titles, please refer to the article below.
About the 301 PDF files accompanying 【BODSOR/mBDSR】
https://www.gogojungle.co.jp/finance/navi/articles/34271
Swiss Franc / Yen 15-minute chart
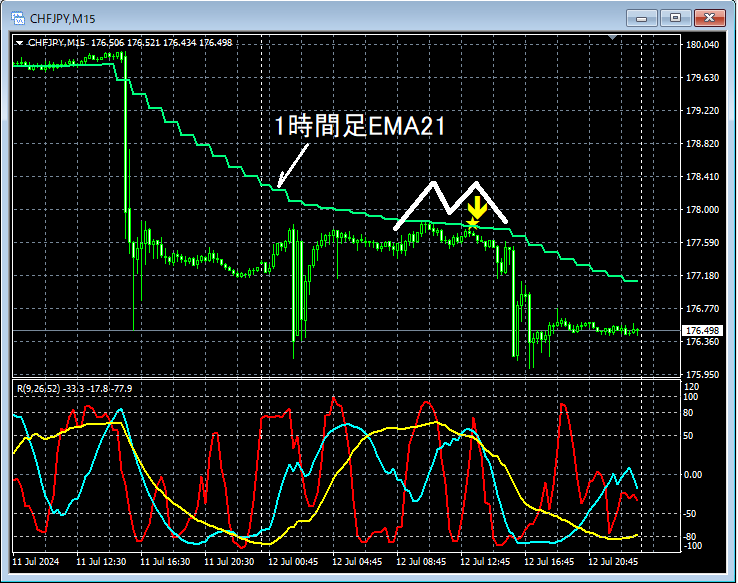
The analysis omits the higher time frame charts, but considering the higher-time-frame conditions, it could be reasonable to look for a pullback-selling setup. Look for signs of rejection near key moving averages. In this example,near the 1-hour EMA21area,mBDSR (filters: RCI26 and RCI52) pullback-sell signallights up and prices drop sharply. As a result,the right shoulder of the double topis where the pullback-sell signal occurs.
From this example,a trading method focusing on pullbacks around moving averages and double topsand thesignals of mBDSRshow a high degree of compatibility.
Also in this example, placing the stop-loss slightly above the most recent high (left shoulder of the double top) allows fora favorable risk-reward trade.
Indicator that shines in combination with RCI: 【BODSOR・mBDSR】
Methods and Case Studies (PDF) ★GogoJungle AWARD2020 winner★
https://www.gogojungle.co.jp/tools/indicators/11836
The PDFs include 301 files (over 1,000 pages in total, over 350,000 characters).
Many of these are composed as examples that logically link higher and lower time frames using the three RCI lines, ultimately considering conditions on the lower time frames for timing of buying on dips or selling on rallies (i.e., the mBDSR signals).Additionally,
there are many that emphasize identifying points where multiple entry reasons align.)
In the explanations,over 1,000 chartsare used.

Methods and Case Studies (PDF) ★GogoJungle AWARD2020 winner★
https://www.gogojungle.co.jp/tools/indicators/11836
The above products include 301 PDFs (methods, case studies, etc.). For a list of the PDF titles, please refer to the article below.
About the 301 PDF files accompanying 【BODSOR/mBDSR】
https://www.gogojungle.co.jp/finance/navi/articles/34271
Swiss Franc / Yen 15-minute chart
The analysis omits the higher time frame charts, but considering the higher-time-frame conditions, it could be reasonable to look for a pullback-selling setup. Look for signs of rejection near key moving averages. In this example,near the 1-hour EMA21area,mBDSR (filters: RCI26 and RCI52) pullback-sell signallights up and prices drop sharply. As a result,the right shoulder of the double topis where the pullback-sell signal occurs.
From this example,a trading method focusing on pullbacks around moving averages and double topsand thesignals of mBDSRshow a high degree of compatibility.
Also in this example, placing the stop-loss slightly above the most recent high (left shoulder of the double top) allows fora favorable risk-reward trade.
Indicator that shines in combination with RCI: 【BODSOR・mBDSR】
Methods and Case Studies (PDF) ★GogoJungle AWARD2020 winner★
https://www.gogojungle.co.jp/tools/indicators/11836
The PDFs include 301 files (over 1,000 pages in total, over 350,000 characters).
Many of these are composed as examples that logically link higher and lower time frames using the three RCI lines, ultimately considering conditions on the lower time frames for timing of buying on dips or selling on rallies (i.e., the mBDSR signals).Additionally,
there are many that emphasize identifying points where multiple entry reasons align.)
In the explanations,over 1,000 chartsare used.
× ![]()


