

Double Bottom Neckline, Moving Averages, Pin Bar, 2B Reversal, and mBDSR (RCI two-line filter) Buy Signal on pullback
0
Indicator that captures “top-bottom and reversal” when combined with RCI: 【mBDSR】
Methods, case studies (PDF) ★GogoJungle AWARD2020 winner★
https://www.gogojungle.co.jp/tools/indicators/11836
The above products include 301 PDFs. For a list of the PDF titles, please see the article below.
About the 301 PDF files included with 【BODSOR・mBDSR】
https://www.gogojungle.co.jp/finance/navi/articles/34271
EURUSD 1-hour chart
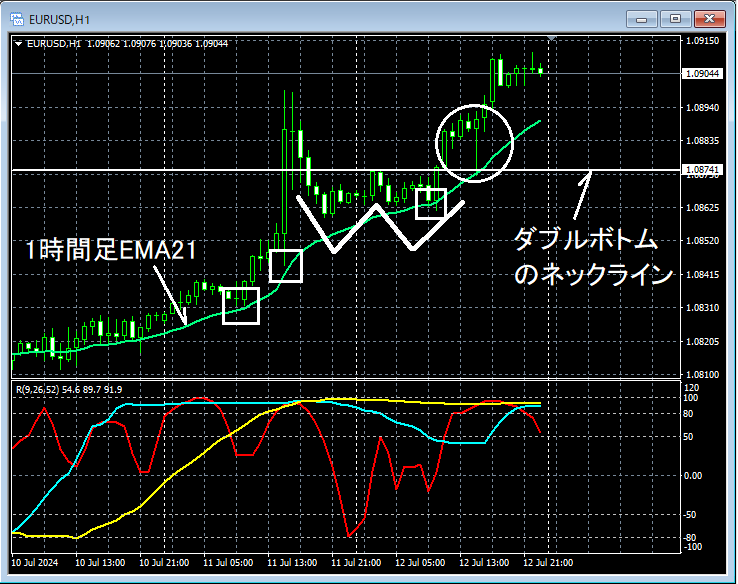
Looking at the area circled in white on the 1-hour chart above, it has been functioning as support1-hour EMA21andthe neck line of a double bottomoverlapped, it dropped, then rapidly rebounded, implying a potential risepin bar (long lower shadow candlestick)appears. It may be a scenario where a pullback-buy on lower timeframes is not surprising.
EURUSD 5-minute chart
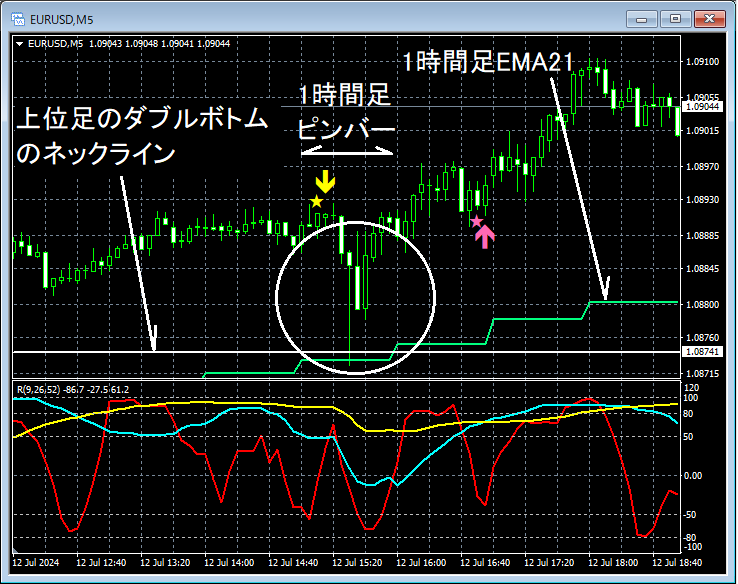
On the higher 5-minute chart around where the white circle on the 5-minute chart (the area where the pin bar appeared on the 1-hour chart)pin barappears, it also suggests a rise on the 5-minute chartpin bar (long lower shadow candlestick)appears, and immediately after that, a similar signal suggesting an rise2B reversal (Two Bar Reversal)is observed. From these, it is not unreasonable to anticipate further upside.
As the chart progresses, on the 1-hour chart thepin barappearing after an initial rise is followed bythe mBDSR (Filter: RCI26 and RCI52) pullback-buy signallighting up and the uptrend resumes.
From this example,a trading approach that focuses on moving averages, the neck line of the double bottom, pin bars, and 2B reversals (Two Bar Reversals)andthe mBDSR signalsshow a strong compatibility.
Indicator that shines in combination with RCI【BODSOR・mBDSR】
Methods, case studies (PDF) ★GogoJungle AWARD2020 winner★
https://www.gogojungle.co.jp/tools/indicators/11836
260 PDF files are included.Most of them are compiled as examples showing a method of logically linking higher and lower timeframes using three RCI lines, and ultimately waiting for pullbacks in the lower timeframes (or reversals in lower timeframes) using the mBDSR signalin explanations,using more than 1,000 charts in total.

Methods, case studies (PDF) ★GogoJungle AWARD2020 winner★
https://www.gogojungle.co.jp/tools/indicators/11836
The above products include 301 PDFs. For a list of the PDF titles, please see the article below.
About the 301 PDF files included with 【BODSOR・mBDSR】
https://www.gogojungle.co.jp/finance/navi/articles/34271
EURUSD 1-hour chart
Looking at the area circled in white on the 1-hour chart above, it has been functioning as support1-hour EMA21andthe neck line of a double bottomoverlapped, it dropped, then rapidly rebounded, implying a potential risepin bar (long lower shadow candlestick)appears. It may be a scenario where a pullback-buy on lower timeframes is not surprising.
EURUSD 5-minute chart
On the higher 5-minute chart around where the white circle on the 5-minute chart (the area where the pin bar appeared on the 1-hour chart)pin barappears, it also suggests a rise on the 5-minute chartpin bar (long lower shadow candlestick)appears, and immediately after that, a similar signal suggesting an rise2B reversal (Two Bar Reversal)is observed. From these, it is not unreasonable to anticipate further upside.
As the chart progresses, on the 1-hour chart thepin barappearing after an initial rise is followed bythe mBDSR (Filter: RCI26 and RCI52) pullback-buy signallighting up and the uptrend resumes.
From this example,a trading approach that focuses on moving averages, the neck line of the double bottom, pin bars, and 2B reversals (Two Bar Reversals)andthe mBDSR signalsshow a strong compatibility.
Indicator that shines in combination with RCI【BODSOR・mBDSR】
Methods, case studies (PDF) ★GogoJungle AWARD2020 winner★
https://www.gogojungle.co.jp/tools/indicators/11836
260 PDF files are included.Most of them are compiled as examples showing a method of logically linking higher and lower timeframes using three RCI lines, and ultimately waiting for pullbacks in the lower timeframes (or reversals in lower timeframes) using the mBDSR signalin explanations,using more than 1,000 charts in total.
× ![]()


