

【Dollar/Yen】U.S. CPI and FX intervention (?). Elliott Wave and mBDSR (RCI two-filter) sell signal
An indicator that captures the bottom and reversal in combination with RCI: 【mBDSR】
Methods, case studies (PDF) ★GogoJungle AWARD 2020 winner★
https://www.gogojungle.co.jp/tools/indicators/11836
This product includes 301 PDF files. For a list of their titles and related information, please see the article below.
About the 301 PDF files bundled with 【BODSOR・mBDSR】
https://www.gogojungle.co.jp/finance/navi/articles/34271
USD/JPY hourly chart
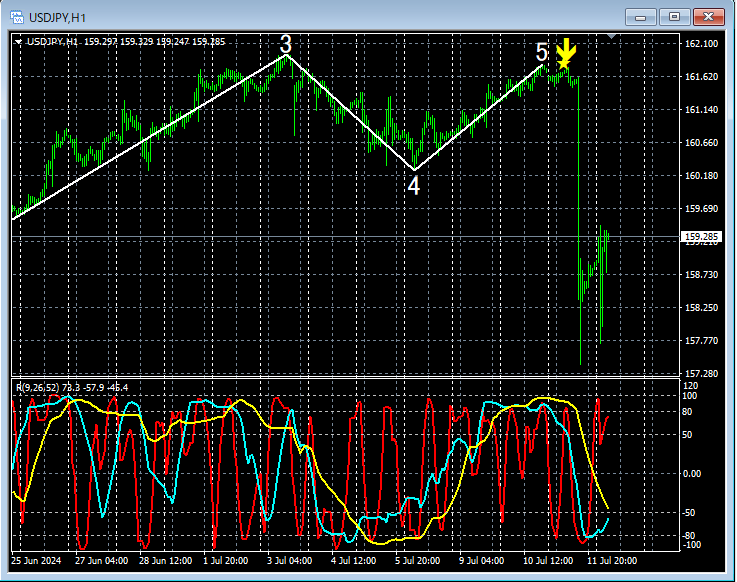
In the above hourly chart,the fifth wave of the Elliott Wave impulse ends in a failure, thenmBDSR (two RCI lines) pullback sell signal lights up,and after the US CPI is released, it drops significantly (there may have been acurrency intervention).
As a result,the signal lights up on the right-hand peak of the double top.
From this example,there is a strong compatibility between Elliott Wave/Doubles Top trading methods andsignals from mBDSR.
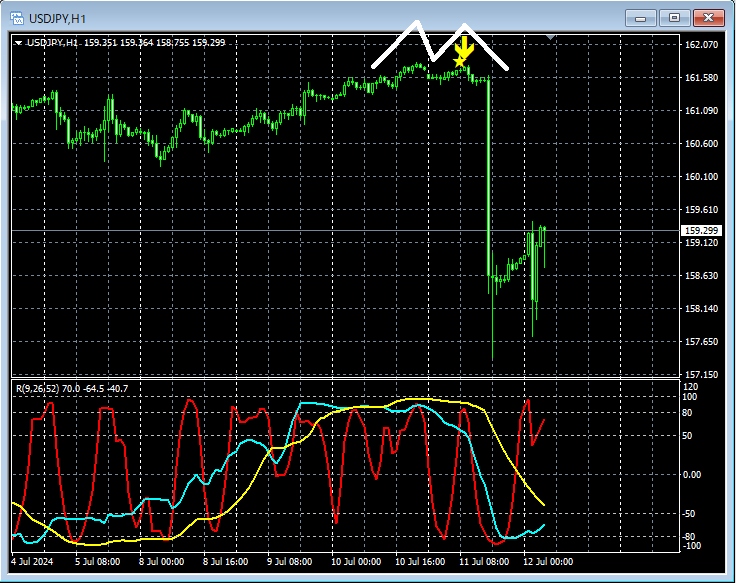
USD/JPY 15-minute chart
On the above 15-minute chart, the mBDSR pullback sell signal for the two RCIs lights up five hours after the hourly chart signalmBDSR (two RCIs) pullback sell lights up.
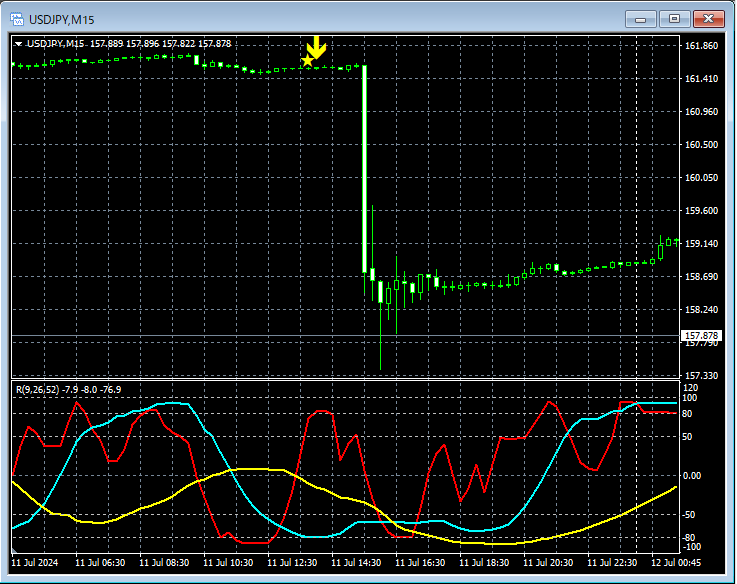
USD/JPY 5-minute chart
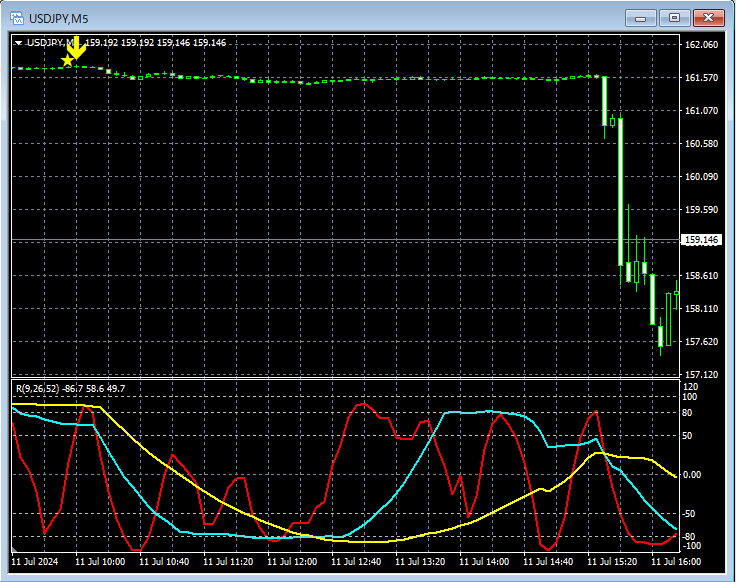
On the above 5-minute chart, the mBDSR pullback sell signal lights up four hours after the hourly chart signalmBDSR (two RCIs) pullback sell lights up.
An indicator that shines in combination with RCI: 【BODSOR・mBDSR】
Methods, case studies (PDF) ★GogoJungle AWARD 2020 winner★
https://www.gogojungle.co.jp/tools/indicators/11836
The PDF files are 301 in total.
Many of them are abouta logical linking of higher and lower timeframes using three RCI lines, examining the状況 of multiple lower timeframes sequentially, and ultimately waiting for buy-the-dottom or pullback sell timing (i.e., mBDSR signals) in the lower timeframes.
Also,many focus on identifying points where multiple entry reasons coincide.
The explanation usesover 1,000 charts.

Methods, case studies (PDF) ★GogoJungle AWARD 2020 winner★
https://www.gogojungle.co.jp/tools/indicators/11836
This product includes 301 PDF files. For a list of their titles and related information, please see the article below.
About the 301 PDF files bundled with 【BODSOR・mBDSR】
https://www.gogojungle.co.jp/finance/navi/articles/34271
USD/JPY hourly chart
In the above hourly chart,the fifth wave of the Elliott Wave impulse ends in a failure, thenmBDSR (two RCI lines) pullback sell signal lights up,and after the US CPI is released, it drops significantly (there may have been acurrency intervention).
As a result,the signal lights up on the right-hand peak of the double top.
From this example,there is a strong compatibility between Elliott Wave/Doubles Top trading methods andsignals from mBDSR.
USD/JPY 15-minute chart
On the above 15-minute chart, the mBDSR pullback sell signal for the two RCIs lights up five hours after the hourly chart signalmBDSR (two RCIs) pullback sell lights up.
USD/JPY 5-minute chart
On the above 5-minute chart, the mBDSR pullback sell signal lights up four hours after the hourly chart signalmBDSR (two RCIs) pullback sell lights up.
An indicator that shines in combination with RCI: 【BODSOR・mBDSR】
Methods, case studies (PDF) ★GogoJungle AWARD 2020 winner★
https://www.gogojungle.co.jp/tools/indicators/11836
The PDF files are 301 in total.
Many of them are abouta logical linking of higher and lower timeframes using three RCI lines, examining the状況 of multiple lower timeframes sequentially, and ultimately waiting for buy-the-dottom or pullback sell timing (i.e., mBDSR signals) in the lower timeframes.
Also,many focus on identifying points where multiple entry reasons coincide.
The explanation usesover 1,000 charts.
× ![]()


