

[From last week's USD/JPY chart] Horizontal line (a line that previously functioned as support) and the return-sell signal from mBDSR (RCI two-line filter)
0
Indicator that captures “tops and bottoms and reversals” in combination with RCI【mBDSR】
Methods and case studies (PDF) ★GogoJungle AWARD2020 Winner★
https://www.gogojungle.co.jp/tools/indicators/11836
This product includes 301 PDFs. For the titles of those PDFs and other details, please see the article below.
About the 301 PDF files included with 【BODSOR・mBDSR】
https://www.gogojungle.co.jp/finance/navi/articles/34271
USD/JPY 5-minute chart
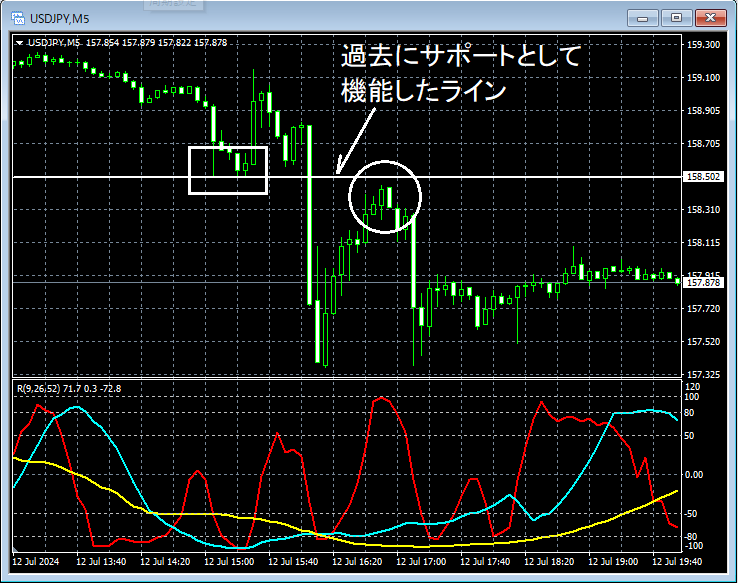
Looking at the area circled in white on the 5-minute chart above,a line that previously acted as support (horizontal line)has risen near it, and it is not unreasonable to think that at least a pullback may occur. We will look for signs of a downward move on lower timeframes.
USD/JPY 1-minute chart
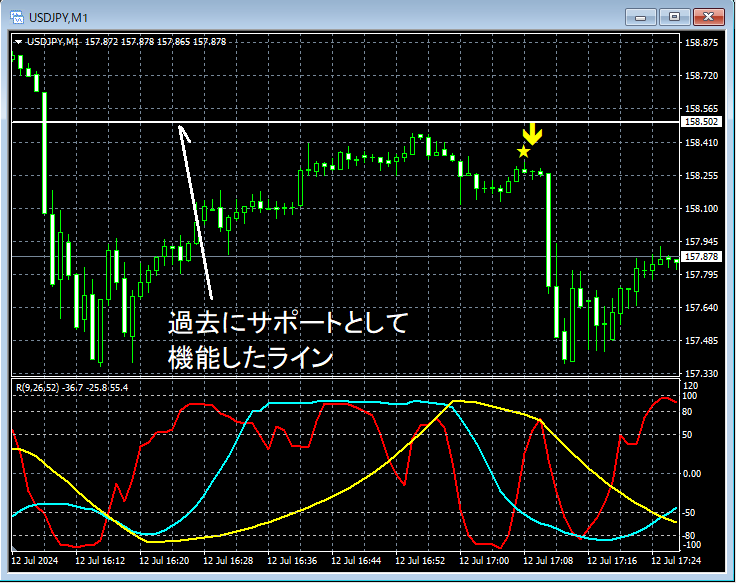
On the above 1-minute chart,the line that previously acted as support (horizontal line)rises to near it and then turns downward.mBDSR (Filter: RCI26 and RCI52) sell signallights up and causes a large drop (the so-calledsupport-resistance flip).
From this example,a trading method that focuses on lines that previously served as supportandthe harmony with mBDSR signalsis evident.
Also, in this example,placing the stop-loss just above the recent highallows for a favorable risk-reward trade.
Indicator that shines when combined with RCI【BODSOR・mBDSR】
Methods and case studies (PDF) ★GogoJungle AWARD2020 Winner★
https://www.gogojungle.co.jp/tools/indicators/11836
The PDF files include 301 items (over 1,000 pages, over 350,000 characters in total).
Many of them are described as follows:A set of examples that logically links higher and lower timeframes using three RCI lines, sequentially considering multiple lower-timeframe situations, and ultimately waiting for pullbacks in the lower timeframe (i.e., mBDSR signals) to time entry.
Additionally,there are many cases that emphasize identifying points where multiple entry reasons overlap.
The explanations usemore than 1,000 charts.

Methods and case studies (PDF) ★GogoJungle AWARD2020 Winner★
https://www.gogojungle.co.jp/tools/indicators/11836
This product includes 301 PDFs. For the titles of those PDFs and other details, please see the article below.
About the 301 PDF files included with 【BODSOR・mBDSR】
https://www.gogojungle.co.jp/finance/navi/articles/34271
USD/JPY 5-minute chart
Looking at the area circled in white on the 5-minute chart above,a line that previously acted as support (horizontal line)has risen near it, and it is not unreasonable to think that at least a pullback may occur. We will look for signs of a downward move on lower timeframes.
USD/JPY 1-minute chart
On the above 1-minute chart,the line that previously acted as support (horizontal line)rises to near it and then turns downward.mBDSR (Filter: RCI26 and RCI52) sell signallights up and causes a large drop (the so-calledsupport-resistance flip).
From this example,a trading method that focuses on lines that previously served as supportandthe harmony with mBDSR signalsis evident.
Also, in this example,placing the stop-loss just above the recent highallows for a favorable risk-reward trade.
Indicator that shines when combined with RCI【BODSOR・mBDSR】
Methods and case studies (PDF) ★GogoJungle AWARD2020 Winner★
https://www.gogojungle.co.jp/tools/indicators/11836
The PDF files include 301 items (over 1,000 pages, over 350,000 characters in total).
Many of them are described as follows:A set of examples that logically links higher and lower timeframes using three RCI lines, sequentially considering multiple lower-timeframe situations, and ultimately waiting for pullbacks in the lower timeframe (i.e., mBDSR signals) to time entry.
Additionally,there are many cases that emphasize identifying points where multiple entry reasons overlap.
The explanations usemore than 1,000 charts.
× ![]()


