

The translation of the provided HTML content to English is: A buy-sign signal for pullback using the moving average that is considered important, the 2B reversal, and the mBDSR (RCI two-filter).
Indicator that captures the bottom and reversal in combination with RCI [mBDSR]
Methods and Case Studies (PDF) ★GogoJungle AWARD2020 Winner★
https://www.gogojungle.co.jp/tools/indicators/11836
This product includes 301 PDF files. For lists of their PDF titles, please refer to the article below.
About the 301 PDF files included with 【BODSOR・mBDSR】
https://www.gogojungle.co.jp/finance/navi/articles/34271
EURCAD 1-Hour Chart
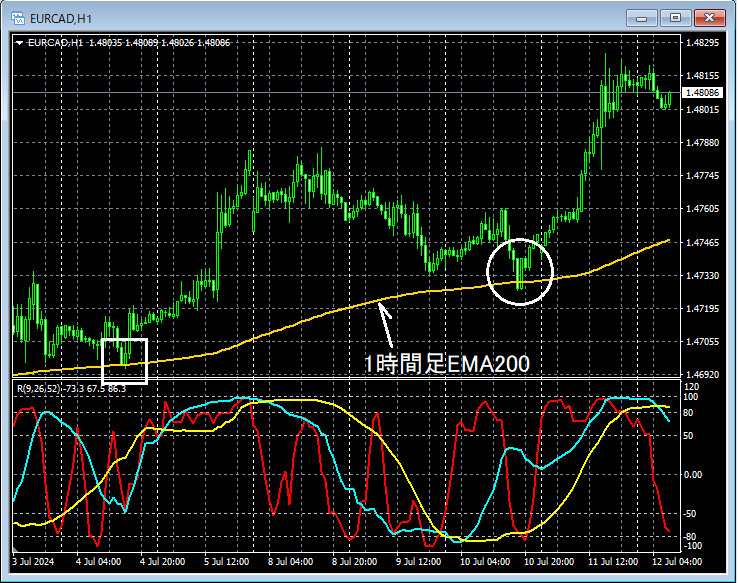
Looking at the area circled by the white circle on the 1-hour chart above, which previously served as supportaround the 200-period EMA on the 1-hour chartit is suggested that it will rise near that areaTwo-Barrier Reversal (2B Reversal)appears to be present. It may not be unusual to consider buying on dips on lower timeframes.
EURCAD 15-Minute Chart
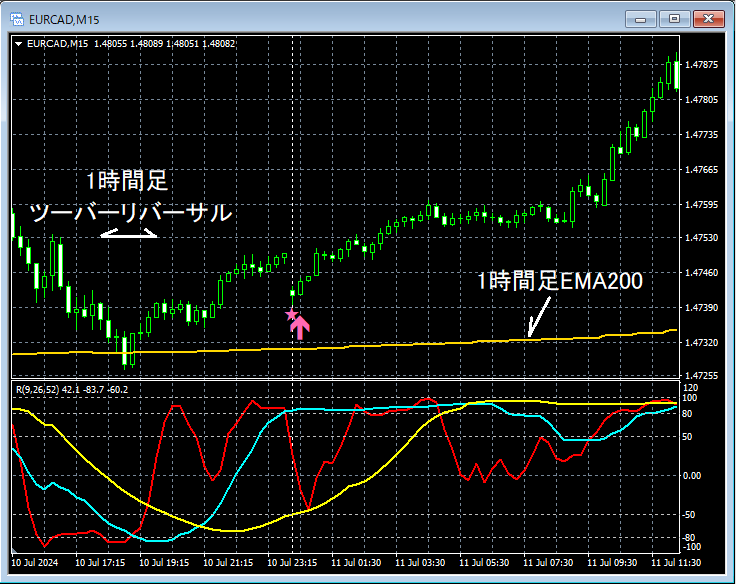
On the 15-minute chart above, in the context of theTwo-Barrier Reversal (2B Reversal)appearance and subsequent decline after a risemBDSR (Filter: RCI26 and RCI52) Dip Buy Signalis lit. Price rises substantially right afterward.
From this example,a trading approach focused on the Two-Barrier Reversal (2B Reversal)andthe signals of mBDSRshow a strong compatibility.
Indicator that shines in combination with RCI【BODSOR・mBDSR】
Methods and Case Studies (PDF) ★GogoJungle AWARD2020 Winner★
https://www.gogojungle.co.jp/tools/indicators/11836
The PDF files total 301 (over 1,000 pages, over 350,000 characters).
Most of them are about summing up examples that logically link higher and lower timeframes by using three RCI lines, sequentially analyzing multiple lower-timeframe conditions, and ultimately waiting for a dip buy or pullback sell timing (i.e., signals of mBDSR) on the lower timeframes.
Also,many focus on identifying points where multiple entry reasons overlapas well.
In the explanations,over 1,000 chartsare used.

Methods and Case Studies (PDF) ★GogoJungle AWARD2020 Winner★
https://www.gogojungle.co.jp/tools/indicators/11836
This product includes 301 PDF files. For lists of their PDF titles, please refer to the article below.
About the 301 PDF files included with 【BODSOR・mBDSR】
https://www.gogojungle.co.jp/finance/navi/articles/34271
EURCAD 1-Hour Chart
Looking at the area circled by the white circle on the 1-hour chart above, which previously served as supportaround the 200-period EMA on the 1-hour chartit is suggested that it will rise near that areaTwo-Barrier Reversal (2B Reversal)appears to be present. It may not be unusual to consider buying on dips on lower timeframes.
EURCAD 15-Minute Chart
On the 15-minute chart above, in the context of theTwo-Barrier Reversal (2B Reversal)appearance and subsequent decline after a risemBDSR (Filter: RCI26 and RCI52) Dip Buy Signalis lit. Price rises substantially right afterward.
From this example,a trading approach focused on the Two-Barrier Reversal (2B Reversal)andthe signals of mBDSRshow a strong compatibility.
Indicator that shines in combination with RCI【BODSOR・mBDSR】
Methods and Case Studies (PDF) ★GogoJungle AWARD2020 Winner★
https://www.gogojungle.co.jp/tools/indicators/11836
The PDF files total 301 (over 1,000 pages, over 350,000 characters).
Most of them are about summing up examples that logically link higher and lower timeframes by using three RCI lines, sequentially analyzing multiple lower-timeframe conditions, and ultimately waiting for a dip buy or pullback sell timing (i.e., signals of mBDSR) on the lower timeframes.
Also,many focus on identifying points where multiple entry reasons overlapas well.
In the explanations,over 1,000 chartsare used.
× ![]()


