

【Dollar Yen】Moves around US CPI and the signal of mBDSR (RCI2 double filter)
Indicator that captures the bottom, reversal in combination with RCI【mBDSR】
Method and Case Study (PDF) ★GogoJungle AWARD2020 Winner★
https://www.gogojungle.co.jp/tools/indicators/11836
This product includes 301 PDF files. For a list of the PDF titles and related information, please refer to the article below.
About the 301 PDF files included with 【BODSOR・mBDSR】
https://www.gogojungle.co.jp/finance/navi/articles/34271
USD/JPY 1-hour chart
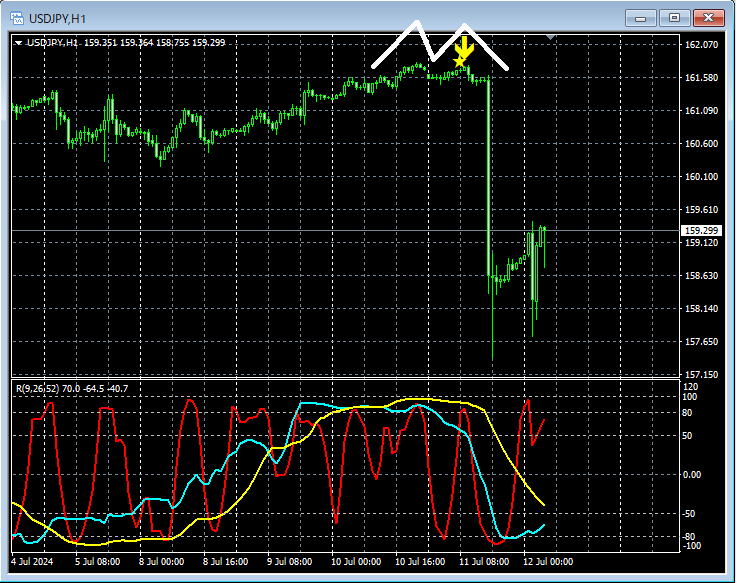
On the above 1-hour chartthe right-side peak of the double topisa sell signal from mBDSR (filters: RCI26 and RCI52)illuminating. Afterwards,the U.S. CPI releasecaused a large drop.
From this example,a trading method focused on the double topandthe signal of mBDSRshow a strong compatibility.
Indicator that shines in combination with RCI【BODSOR・mBDSR】
Method and Case Study (PDF) ★GogoJungle AWARD2020 Winner★
https://www.gogojungle.co.jp/tools/indicators/11836
PDF files amount to 301 (over 1,000 pages, over 350,000 characters in total).
Most of them aresummaries of how to logically link higher time frames with lower time frames using three RCI lines, progressively examining multiple lower-time-frame conditions, and finally waiting for entry timing in the lower time frame (i.e., the mBDSR signal).
Additionally,many focus on identifying points where multiple entry reasons coincide..
In the explanations,more than 1,000 chartsare used.

Method and Case Study (PDF) ★GogoJungle AWARD2020 Winner★
https://www.gogojungle.co.jp/tools/indicators/11836
This product includes 301 PDF files. For a list of the PDF titles and related information, please refer to the article below.
About the 301 PDF files included with 【BODSOR・mBDSR】
https://www.gogojungle.co.jp/finance/navi/articles/34271
USD/JPY 1-hour chart
On the above 1-hour chartthe right-side peak of the double topisa sell signal from mBDSR (filters: RCI26 and RCI52)illuminating. Afterwards,the U.S. CPI releasecaused a large drop.
From this example,a trading method focused on the double topandthe signal of mBDSRshow a strong compatibility.
Indicator that shines in combination with RCI【BODSOR・mBDSR】
Method and Case Study (PDF) ★GogoJungle AWARD2020 Winner★
https://www.gogojungle.co.jp/tools/indicators/11836
PDF files amount to 301 (over 1,000 pages, over 350,000 characters in total).
Most of them aresummaries of how to logically link higher time frames with lower time frames using three RCI lines, progressively examining multiple lower-time-frame conditions, and finally waiting for entry timing in the lower time frame (i.e., the mBDSR signal).
Additionally,many focus on identifying points where multiple entry reasons coincide..
In the explanations,more than 1,000 chartsare used.
× ![]()


