

[Gold Research] Elliott Wave, Fibonacci Expansion, and RCI Three-Line Signal with mBDSR — From the Latest Chart -
Indicator that captures “tops and bottoms and reversals” in combination with RCI: 【mBDSR】
Methods and Case Studies (PDF) ★GogoJungle AWARD2020 Winner★
https://www.gogojungle.co.jp/tools/indicators/11836
The above product includes 301 PDFs. For a list of the titles of those PDFs, please see the article below.
About the 301 PDF files that come with 【BODSOR・mBDSR】
https://www.gogojungle.co.jp/finance/navi/articles/34271
Gold XAUUSD 4-hour chart
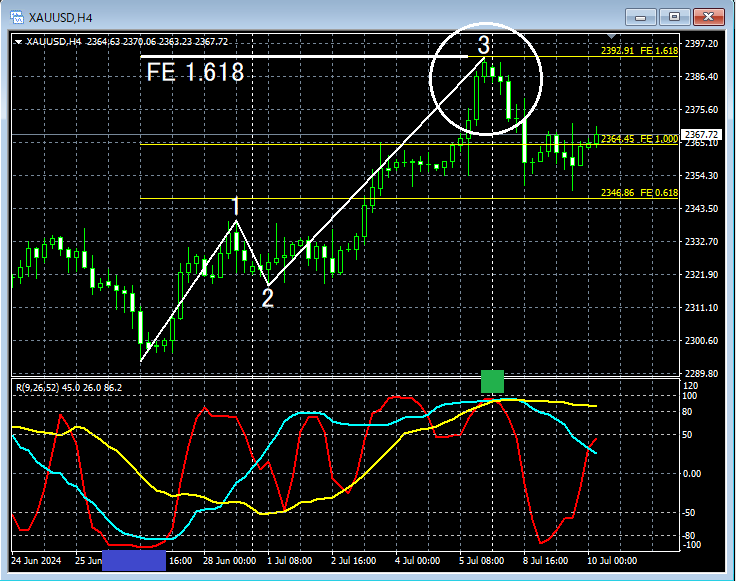
On the 4-hour chart above,Fibonacci extensionapplied shows that around the area circled in white,Fibonacci extension 1.618marks a level up to near a milestone. Also,three-line RCIis rising to a so-calledRCI triple toppattern (around the green square), and it may not be surprising to expect a small pullback. We will monitor the chart for signs of a downmove on the lower timeframes. (Note that the displayedElliott countis based on the 1-hour chart.)
If the third wave ends on the 1-hour chart, there may be a reasonable downside on the lower timeframes.
Additionally, while it is possible to progressively down-sample from the 4-hour chart to lower timeframes, the method is covered in the accompanying PDF. The 15-minute chart is not chosen arbitrarily as a suitable lower timeframe.
Gold XAUUSD 15-minute chart

Watching the 15-minute chart above,mBDSR (Filter: RCI26 and RCI52) sell signallights up, and subsequently the price declines smoothly.
From this example,a trading method focusing on Elliott waves, Fibonacci extensions, and RCI triple linesandthe signals of mBDSRshow a high degree of compatibility.
Also, in this example, placing the stop-loss slightly above the recent high can enable a high risk-reward trade.
Indicator that shines in combination with RCI: 【BODSOR・mBDSR】
Methods and Case Studies (PDF) ★GogoJungle AWARD2020 Winner★
https://www.gogojungle.co.jp/tools/indicators/11836
The PDFs comprise 301 files (over 1,000 pages, over 350,000 characters in total).
Many of them are focused on summarizing how to logically link higher timeframes with lower timeframes using the three-line RCI, progressively evaluating multiple lower timeframes, and ultimately waiting for pullbacks or rebounds on the lower timeframes (i.e., the mBDSR signals).
Additionally,many of them emphasize identifying points where multiple entry reasons coincide.There are many such cases.
The explanations usemore than 1,000 charts..

Methods and Case Studies (PDF) ★GogoJungle AWARD2020 Winner★
https://www.gogojungle.co.jp/tools/indicators/11836
The above product includes 301 PDFs. For a list of the titles of those PDFs, please see the article below.
About the 301 PDF files that come with 【BODSOR・mBDSR】
https://www.gogojungle.co.jp/finance/navi/articles/34271
Gold XAUUSD 4-hour chart
On the 4-hour chart above,Fibonacci extensionapplied shows that around the area circled in white,Fibonacci extension 1.618marks a level up to near a milestone. Also,three-line RCIis rising to a so-calledRCI triple toppattern (around the green square), and it may not be surprising to expect a small pullback. We will monitor the chart for signs of a downmove on the lower timeframes. (Note that the displayedElliott countis based on the 1-hour chart.)
If the third wave ends on the 1-hour chart, there may be a reasonable downside on the lower timeframes.
Additionally, while it is possible to progressively down-sample from the 4-hour chart to lower timeframes, the method is covered in the accompanying PDF. The 15-minute chart is not chosen arbitrarily as a suitable lower timeframe.
Gold XAUUSD 15-minute chart
Watching the 15-minute chart above,mBDSR (Filter: RCI26 and RCI52) sell signallights up, and subsequently the price declines smoothly.
From this example,a trading method focusing on Elliott waves, Fibonacci extensions, and RCI triple linesandthe signals of mBDSRshow a high degree of compatibility.
Also, in this example, placing the stop-loss slightly above the recent high can enable a high risk-reward trade.
Indicator that shines in combination with RCI: 【BODSOR・mBDSR】
Methods and Case Studies (PDF) ★GogoJungle AWARD2020 Winner★
https://www.gogojungle.co.jp/tools/indicators/11836
The PDFs comprise 301 files (over 1,000 pages, over 350,000 characters in total).
Many of them are focused on summarizing how to logically link higher timeframes with lower timeframes using the three-line RCI, progressively evaluating multiple lower timeframes, and ultimately waiting for pullbacks or rebounds on the lower timeframes (i.e., the mBDSR signals).
Additionally,many of them emphasize identifying points where multiple entry reasons coincide.There are many such cases.
The explanations usemore than 1,000 charts..
× ![]()


