

[Chart Study] Short-selling signals: Pin bar on higher timeframes and mbDSR pullback sell signals on lower timeframes
0
An Indicator that Captures Troughs and Reversals in Combination with RCI: 【mBDSR】
Methods, Case Studies (PDF) ★GogoJungle AWARD2020 Winner★
https://www.gogojungle.co.jp/tools/indicators/11836
The above product includes 301 PDFs. For a list of the PDF titles, please refer to the article below.
About the 301 PDF files included with【BODSOR・mBDSR】
https://www.gogojungle.co.jp/finance/navi/articles/34271
CADCHF Daily
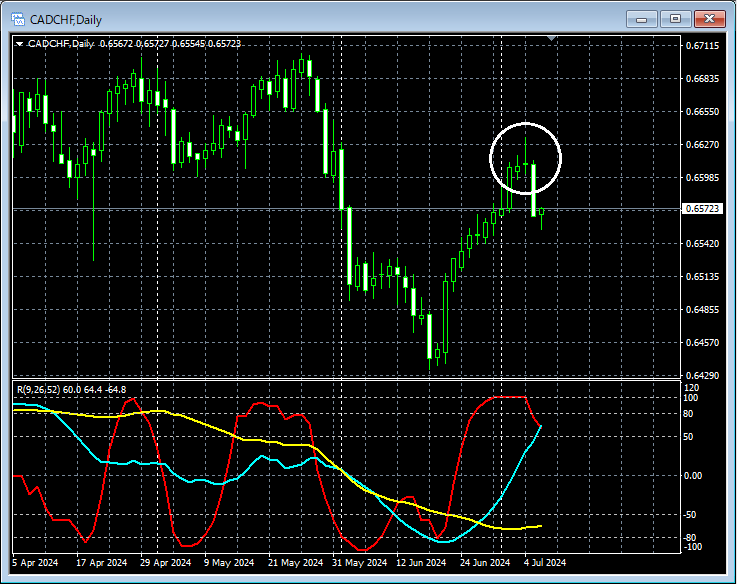
Looking at the area circled by the white circle on the daily chart above suggests a downtrendPin Bar(A candlestick with a long upper wick) has appeared, which may be a scenario where one considers selling on rallies on lower timeframes. In this case, thePin Baris a pattern where traders who jumped on the strong rise get caught. Public sentiment is interpreted as bearish.
CADCHF 1-Hour
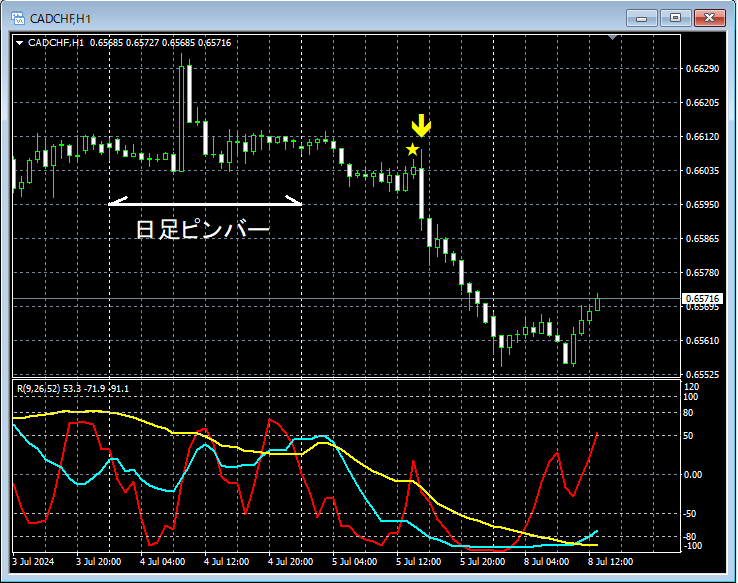
In the 1-hour chart above, after the daily Pin BarPin Barappeared and the price fell, themBDSR (Filter: RCI26 and RCI52) Sell signallights up and the price continues to fall.
From this example,a high degree of synergy between Pin Bar-focused trading methodsandmBDSR signalsis evident.
An indicator that shines in combination with RCI: 【BODSOR・mBDSR】
Methods, Case Studies (PDF) ★GogoJungle AWARD2020 Winner★
https://www.gogojungle.co.jp/tools/indicators/11836
The included PDF files number 301 (over 1,000 pages, over 350,000 characters).
Many of them are formed around the idea of linking higher and lower timeframes logically using three RCI lines, then progressively examining multiple lower-timeframe situations, ultimately waiting for a timing to buy on dips or sell on rallies on the lower timeframes (i.e., mBDSR signals).
Additionally,there are many cases that emphasize capturing points where multiple entry bases overlap..
The explanations useover 1,000 charts.

Methods, Case Studies (PDF) ★GogoJungle AWARD2020 Winner★
https://www.gogojungle.co.jp/tools/indicators/11836
The above product includes 301 PDFs. For a list of the PDF titles, please refer to the article below.
About the 301 PDF files included with【BODSOR・mBDSR】
https://www.gogojungle.co.jp/finance/navi/articles/34271
CADCHF Daily
Looking at the area circled by the white circle on the daily chart above suggests a downtrendPin Bar(A candlestick with a long upper wick) has appeared, which may be a scenario where one considers selling on rallies on lower timeframes. In this case, thePin Baris a pattern where traders who jumped on the strong rise get caught. Public sentiment is interpreted as bearish.
CADCHF 1-Hour
In the 1-hour chart above, after the daily Pin BarPin Barappeared and the price fell, themBDSR (Filter: RCI26 and RCI52) Sell signallights up and the price continues to fall.
From this example,a high degree of synergy between Pin Bar-focused trading methodsandmBDSR signalsis evident.
An indicator that shines in combination with RCI: 【BODSOR・mBDSR】
Methods, Case Studies (PDF) ★GogoJungle AWARD2020 Winner★
https://www.gogojungle.co.jp/tools/indicators/11836
The included PDF files number 301 (over 1,000 pages, over 350,000 characters).
Many of them are formed around the idea of linking higher and lower timeframes logically using three RCI lines, then progressively examining multiple lower-timeframe situations, ultimately waiting for a timing to buy on dips or sell on rallies on the lower timeframes (i.e., mBDSR signals).
Additionally,there are many cases that emphasize capturing points where multiple entry bases overlap..
The explanations useover 1,000 charts.
× ![]()


