

[Chart Research] Rebound from Resistance Zone and mBDSR (RCI 2-lines filter) Buy-the-dip Signal
Indicator 【mBDSR】 that captures “tops/bottoms and reversals” in combination with RCI
and method & case studies (PDF) ★GogoJungle AWARD 2020 winner★
https://www.gogojungle.co.jp/tools/indicators/11836
The above product includes 301 PDFs (methods, case studies, etc.). For a list of titles of those PDFs, please see the article below.
About the 301 PDF files included with 【BODSOR・mBDSR】
https://www.gogojungle.co.jp/finance/navi/articles/34271
GBPCAD 4-hour chart
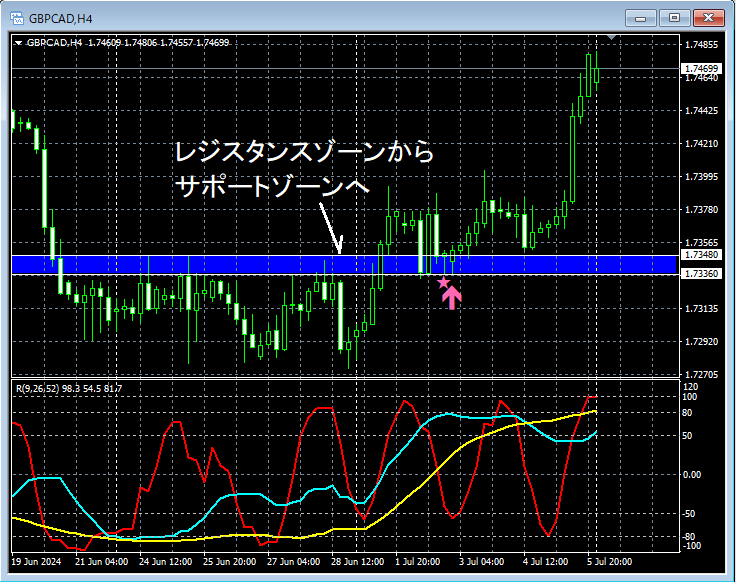
The higher time-frame chart is omitted, but in the 4-hour chart above, the zone shown in blue has historically functioned as resistance or support on the daily chart as well. In the 4-hour chart,Support Zonearound whichmBDSR (Filter: RCI26 and RCI52) pullback-buy signallights up and the price rebounds significantly.
From this example,a trading method focused on rebounds in the support zoneandthe compatibility with mBDSR signalsare evident.
Indicator that shines in combination with RCI: 【BODSOR・mBDSR】
and method & case studies (PDF) ★GogoJungle AWARD2020 winner★
https://www.gogojungle.co.jp/tools/indicators/11836
The PDF files include 301 files (over 1,000 pages, over 350,000 characters in total).
Many of them aresummaries of examples that logically link higher and lower timeframes using three RCI lines, sequentially considering the conditions of multiple lower timeframes, and ultimately waiting for pullback-buying or rally-sell timing on the lower timeframes (i.e., the signals of mBDSR).
In addition,many focus on identifying points where multiple entry reasons overlap.
The explanations usemore than 1,000 charts.

and method & case studies (PDF) ★GogoJungle AWARD 2020 winner★
https://www.gogojungle.co.jp/tools/indicators/11836
The above product includes 301 PDFs (methods, case studies, etc.). For a list of titles of those PDFs, please see the article below.
About the 301 PDF files included with 【BODSOR・mBDSR】
https://www.gogojungle.co.jp/finance/navi/articles/34271
GBPCAD 4-hour chart
The higher time-frame chart is omitted, but in the 4-hour chart above, the zone shown in blue has historically functioned as resistance or support on the daily chart as well. In the 4-hour chart,Support Zonearound whichmBDSR (Filter: RCI26 and RCI52) pullback-buy signallights up and the price rebounds significantly.
From this example,a trading method focused on rebounds in the support zoneandthe compatibility with mBDSR signalsare evident.
Indicator that shines in combination with RCI: 【BODSOR・mBDSR】
and method & case studies (PDF) ★GogoJungle AWARD2020 winner★
https://www.gogojungle.co.jp/tools/indicators/11836
The PDF files include 301 files (over 1,000 pages, over 350,000 characters in total).
Many of them aresummaries of examples that logically link higher and lower timeframes using three RCI lines, sequentially considering the conditions of multiple lower timeframes, and ultimately waiting for pullback-buying or rally-sell timing on the lower timeframes (i.e., the signals of mBDSR).
In addition,many focus on identifying points where multiple entry reasons overlap.
The explanations usemore than 1,000 charts.
× ![]()


