

From yesterday's chart—the resistance/support reversal line, a double bottom, and the mbDSR (RCI two-filter) signals—
0
Indicator that captures bottom and reversal when combined with RCI, 【mBDSR】
Methods and case studies (PDF) ★GogoJungle AWARD2020 Winner★
https://www.gogojungle.co.jp/tools/indicators/11836
The above product includes 301 PDFs. For the list of their titles, please see the article below.
About the 301 PDF files included with 【BODSOR・mBDSR】
https://www.gogojungle.co.jp/finance/navi/articles/34271
Euro/NZ Dollar – 15-minute chart
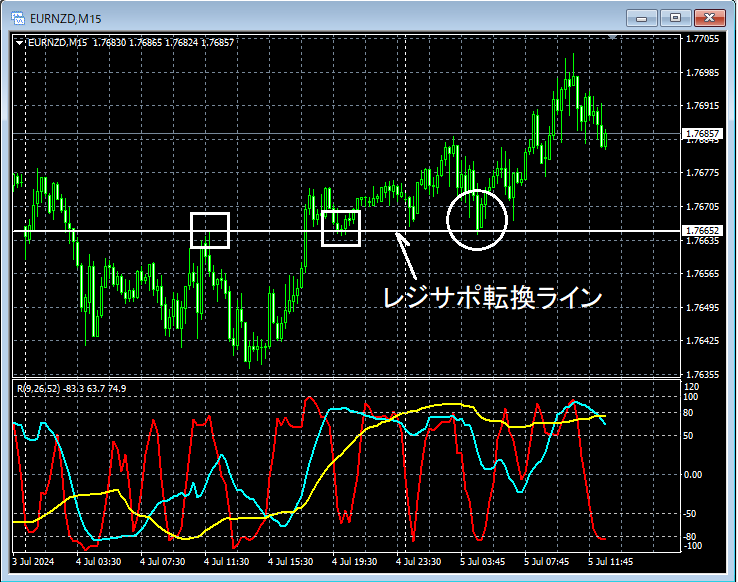
Looking at the area circled in white on the 15-minute chart abovethe horizontal lines that have been recognized as resistance or support in the past (resistance-support turning lines)have been pushed down near that area, and at least it is not unreasonable to think there may be a rebound at least once.
Euro/NZ Dollar – 1-minute chart
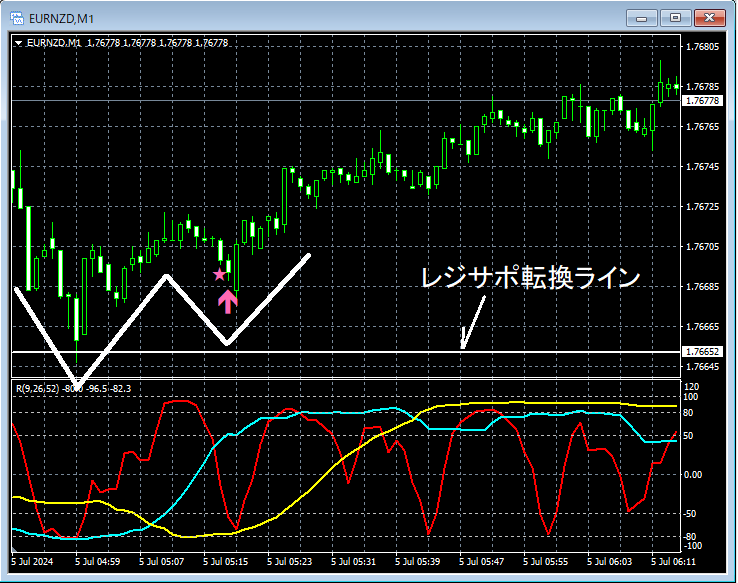
On the 1-minute chart above,the horizontal lines that have been recognized as resistance or support in the past (resistance-support turning lines)nearbydouble bottomis formed and clearly rising. Also,the timing to start rising at the right-side valley of the double bottomis well captured bymBDSR (filter: RCI26 and RCI52) pullback buying signalas shown.
From this example,the compatibility between a trade method focusing on resistance/support turning lines and double bottomsandthe signals of mBDSRis evident.
Also in this example, placing a stop slightly below the most recent low (left valley of the double bottomlow) makes for a favorable risk-reward trade.
Indicator that excels when combined with RCI: 【BODSOR・mBDSR】
Methods and case studies (PDF) ★GogoJungle AWARD2020 Winner★
https://www.gogojungle.co.jp/tools/indicators/11836
The PDF includes 301 files (over 1,000 pages total, over 350,000 characters)
Many of them areexamples that link multiple higher and lower timeframes logically using the RCI triple-line, sequentially considering the status of multiple lower timeframes, and ultimately waiting for pullback buying or retracement selling timing (i.e., the mBDSR signal) on the lower timeframe.
Additionally,many entries focus on identifying points where multiple entry criteria overlap.
The explanations usemore than 1,000 charts.

Methods and case studies (PDF) ★GogoJungle AWARD2020 Winner★
https://www.gogojungle.co.jp/tools/indicators/11836
The above product includes 301 PDFs. For the list of their titles, please see the article below.
About the 301 PDF files included with 【BODSOR・mBDSR】
https://www.gogojungle.co.jp/finance/navi/articles/34271
Euro/NZ Dollar – 15-minute chart
Looking at the area circled in white on the 15-minute chart abovethe horizontal lines that have been recognized as resistance or support in the past (resistance-support turning lines)have been pushed down near that area, and at least it is not unreasonable to think there may be a rebound at least once.
Euro/NZ Dollar – 1-minute chart
On the 1-minute chart above,the horizontal lines that have been recognized as resistance or support in the past (resistance-support turning lines)nearbydouble bottomis formed and clearly rising. Also,the timing to start rising at the right-side valley of the double bottomis well captured bymBDSR (filter: RCI26 and RCI52) pullback buying signalas shown.
From this example,the compatibility between a trade method focusing on resistance/support turning lines and double bottomsandthe signals of mBDSRis evident.
Also in this example, placing a stop slightly below the most recent low (left valley of the double bottomlow) makes for a favorable risk-reward trade.
Indicator that excels when combined with RCI: 【BODSOR・mBDSR】
Methods and case studies (PDF) ★GogoJungle AWARD2020 Winner★
https://www.gogojungle.co.jp/tools/indicators/11836
The PDF includes 301 files (over 1,000 pages total, over 350,000 characters)
Many of them areexamples that link multiple higher and lower timeframes logically using the RCI triple-line, sequentially considering the status of multiple lower timeframes, and ultimately waiting for pullback buying or retracement selling timing (i.e., the mBDSR signal) on the lower timeframe.
Additionally,many entries focus on identifying points where multiple entry criteria overlap.
The explanations usemore than 1,000 charts.
× ![]()


