

From the latest EUR/JPY chart, aiming for a double top, July 5, 2024
0
Indicator to Capture Tops and Reversals in Combination with RCI: 【mBDSR】
Methods and Case Studies (PDF) ★GogoJungle AWARD2020 Winner★
https://www.gogojungle.co.jp/tools/indicators/11836
The above products include 301 PDFs. For a list of the titles of those PDFs and other details, please see the article below.
About the 301 PDF files accompanying 【BODSOR・mBDSR】
https://www.gogojungle.co.jp/finance/navi/articles/34271
EUR/JPY 1-hour chart
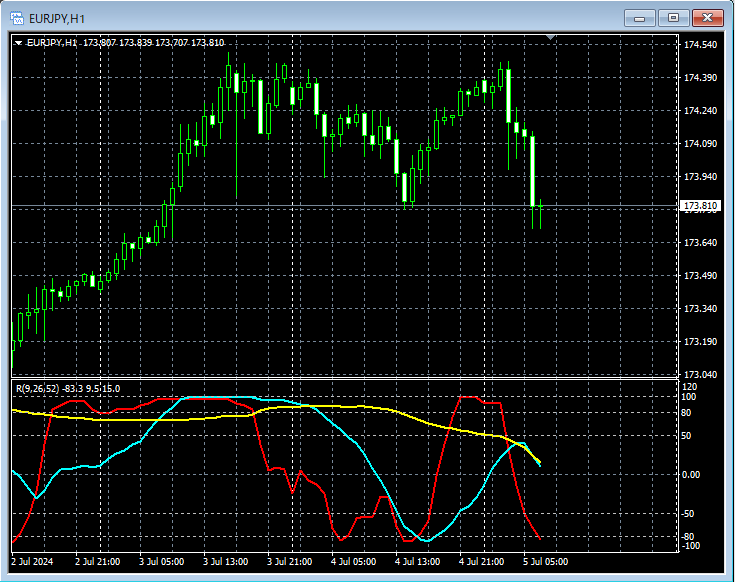
Looking at the 1-hour chart above,a Double Topis forming and appears to be topping.
EUR/JPY 5-minute chart
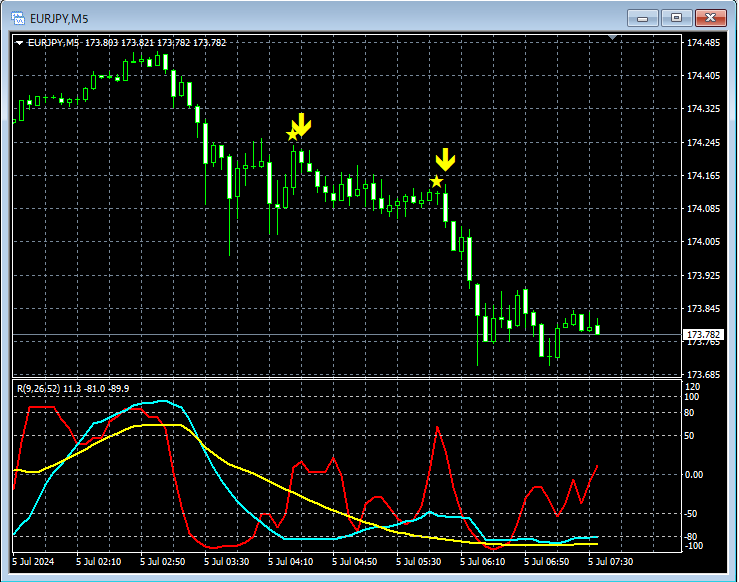
Looking at the 5-minute chart above, from the right peak of the 1-hour chart’sDouble Topthere is a decline in progressmBDSR (two RCI filters) sell signallighting up twice.
From this example,a trading method aiming to form a Double Topandthe signals of mBDSRshow strong compatibility.
Indicator that shines in combination with RCI: 【BODSOR・mBDSR】
Methods and Case Studies (PDF) ★GogoJungle AWARD2020 Winner★
https://www.gogojungle.co.jp/tools/indicators/11836
The PDF files include 301 items (over 1,000 pages, over 350,000 characters in total).
Most of them involve a setup where multiple lower-timeframe conditions are linked logically using three RCI lines to the higher timeframe, and finally wait for a buying entry on pullbacks or selling on rallies (i.e., mBDSR signals) in the lower timeframe, which is summarized in the examples.In addition,
many contents focus on identifying points where multiple entry reasons coincide.There are many such cases.
The explanations useover 1,000 chartsin total.

Methods and Case Studies (PDF) ★GogoJungle AWARD2020 Winner★
https://www.gogojungle.co.jp/tools/indicators/11836
The above products include 301 PDFs. For a list of the titles of those PDFs and other details, please see the article below.
About the 301 PDF files accompanying 【BODSOR・mBDSR】
https://www.gogojungle.co.jp/finance/navi/articles/34271
EUR/JPY 1-hour chart
Looking at the 1-hour chart above,a Double Topis forming and appears to be topping.
EUR/JPY 5-minute chart
Looking at the 5-minute chart above, from the right peak of the 1-hour chart’sDouble Topthere is a decline in progressmBDSR (two RCI filters) sell signallighting up twice.
From this example,a trading method aiming to form a Double Topandthe signals of mBDSRshow strong compatibility.
Indicator that shines in combination with RCI: 【BODSOR・mBDSR】
Methods and Case Studies (PDF) ★GogoJungle AWARD2020 Winner★
https://www.gogojungle.co.jp/tools/indicators/11836
The PDF files include 301 items (over 1,000 pages, over 350,000 characters in total).
Most of them involve a setup where multiple lower-timeframe conditions are linked logically using three RCI lines to the higher timeframe, and finally wait for a buying entry on pullbacks or selling on rallies (i.e., mBDSR signals) in the lower timeframe, which is summarized in the examples.In addition,
many contents focus on identifying points where multiple entry reasons coincide.There are many such cases.
The explanations useover 1,000 chartsin total.
× ![]()


