

[Chart Study] Fibonacci Retracement, Double Bottom, Neckline, and mBDSR Signals
0
Indicator that captures bottom and reversal when used in combination with RCI: 【mBDSR】
Methods and Case Studies (PDF) ★GogoJungle AWARD2020 Winner★
https://www.gogojungle.co.jp/tools/indicators/11836
The above products include 301 PDFs. For a list of the PDF titles, please see the article below.
About the 301 PDF files included with 【BODSOR・mBDSR】
https://www.gogojungle.co.jp/finance/navi/articles/34271
EURJPY 1-hour
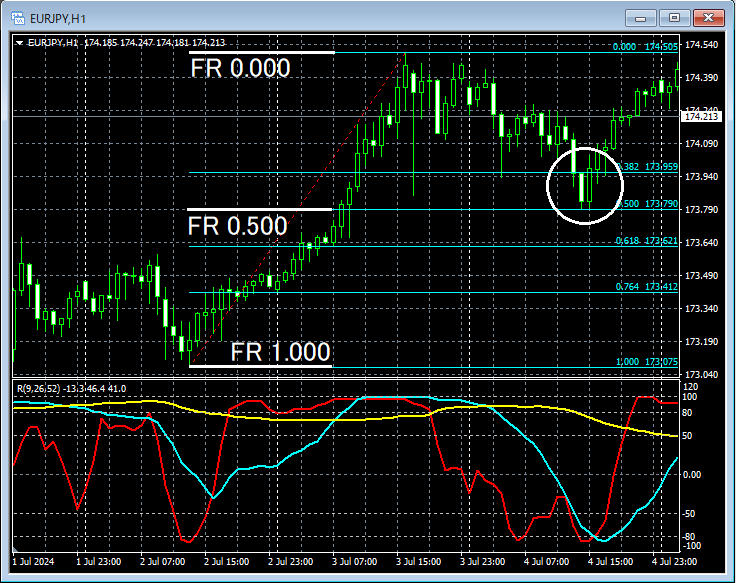
Although the charts of the higher timeframes are omitted, since the higher timeframe shows a strong rise, we will consider the depth of pullbacks.Fibonacci retracementwill be applied. Looking at the area encircled in white on the 1-hour chart above,Fibonacci retracement 0.500drops nearby, and we will also look for signs of reversal on the lower timeframe.
EURJPY 5-minute
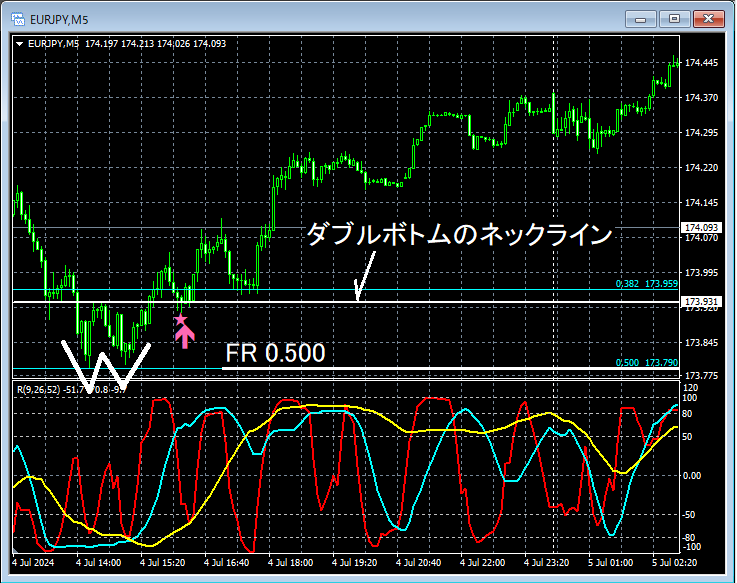
On the 5-minute chart above, after the aforementionedFibonacci retracement 0.500drop,Double bottomforms and rebounds. And then,double bottomnecklinearea where themBDSR (Filter: RCI26 and RCI52) pullback buying signallights up and continues to rise.
From this example,a trading method focusing on Fibonacci retracement, double bottoms, and their necklineandthe signals of mBDSRshow a strong synergy.
An indicator that shines in combination with RCI: 【BODSOR・mBDSR】
Methods and Case Studies (PDF) ★GogoJungle AWARD2020 Winner★
https://www.gogojungle.co.jp/tools/indicators/11836
The PDF files include 301 PDFs (over 1,000 pages, over 350,000 characters in total).
Many of them are about logically linking the higher and lower timeframes using three RCI lines to examine multiple lower-timeframe conditions sequentially and ultimately wait for pullbacks in the lower timeframe or selling rallies (i.e., mBDSR signals).
Also,there are many that focus on identifying points where multiple entry reasons overlap..
The descriptions useover 1,000 charts.

Methods and Case Studies (PDF) ★GogoJungle AWARD2020 Winner★
https://www.gogojungle.co.jp/tools/indicators/11836
The above products include 301 PDFs. For a list of the PDF titles, please see the article below.
About the 301 PDF files included with 【BODSOR・mBDSR】
https://www.gogojungle.co.jp/finance/navi/articles/34271
EURJPY 1-hour
Although the charts of the higher timeframes are omitted, since the higher timeframe shows a strong rise, we will consider the depth of pullbacks.Fibonacci retracementwill be applied. Looking at the area encircled in white on the 1-hour chart above,Fibonacci retracement 0.500drops nearby, and we will also look for signs of reversal on the lower timeframe.
EURJPY 5-minute
On the 5-minute chart above, after the aforementionedFibonacci retracement 0.500drop,Double bottomforms and rebounds. And then,double bottomnecklinearea where themBDSR (Filter: RCI26 and RCI52) pullback buying signallights up and continues to rise.
From this example,a trading method focusing on Fibonacci retracement, double bottoms, and their necklineandthe signals of mBDSRshow a strong synergy.
An indicator that shines in combination with RCI: 【BODSOR・mBDSR】
Methods and Case Studies (PDF) ★GogoJungle AWARD2020 Winner★
https://www.gogojungle.co.jp/tools/indicators/11836
The PDF files include 301 PDFs (over 1,000 pages, over 350,000 characters in total).
Many of them are about logically linking the higher and lower timeframes using three RCI lines to examine multiple lower-timeframe conditions sequentially and ultimately wait for pullbacks in the lower timeframe or selling rallies (i.e., mBDSR signals).
Also,there are many that focus on identifying points where multiple entry reasons overlap..
The descriptions useover 1,000 charts.
× ![]()


