

【Cross Yen Trends】 Double top and mBDSR (RCI two-line filter) return-sell signal
0
Indicator “Capture Bottoms, Reversals” in combination with RCI【mBDSR】
Method & Case Study (PDF) ★GogoJungle AWARD2020 Winner★
https://www.gogojungle.co.jp/tools/indicators/11836
The above products include 301 PDFs. For a list of their PDF titles and other details, please see the article below.
About the 301 PDF files included with 【BODSOR・mBDSR】
https://www.gogojungle.co.jp/finance/navi/articles/34271
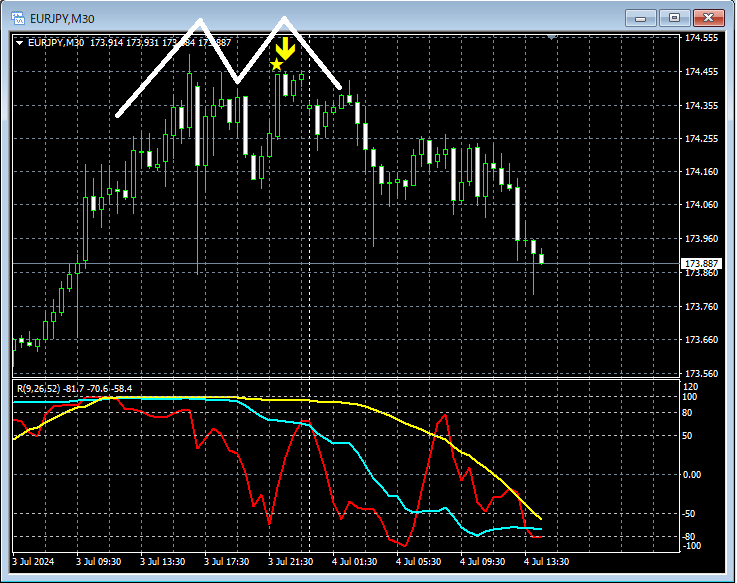
EURJPY 30-minute chart
GBPJPY 30-minute chart
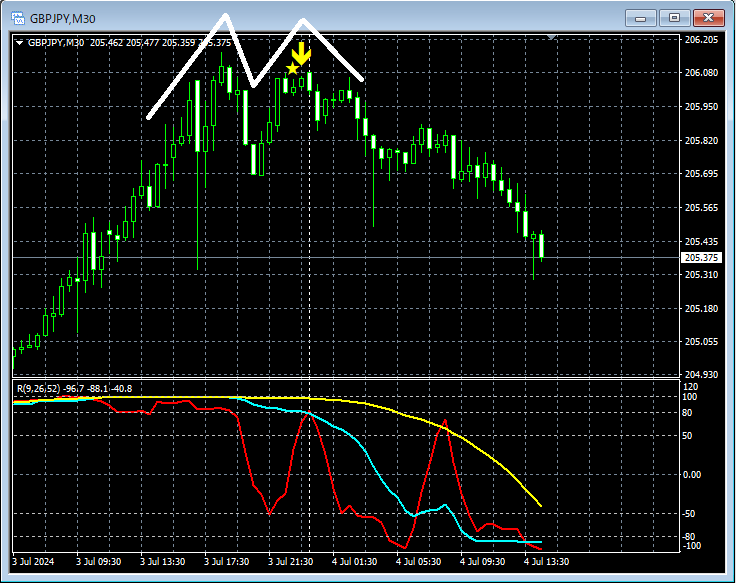
In the 30-minute chart above,the right peak of the double topisthe mBDSR (two RCI lines) return-sell signallighting up and moving down.
From this example,a trading method focused on the double topandthe signals of mBDSRshow a high degree of compatibility.
In such patterns, placing the stop-loss a little above the left peak of the double topallows for favorable risk-reward tradeswith a favorable risk-reward profile.
Indicator that shines in combination with RCI: 【BODSOR・mBDSR】
Method & Case Study (PDF) ★GogoJungle AWARD2020 Winner★
https://www.gogojungle.co.jp/tools/indicators/11836
The PDF files total 301 items (over 1,000 pages, over 350,000 characters).
Most of these are about reasoning how to logically link higher and lower timeframes using three RCI lines, and finally obtaining the timing to buy dips or to sell retracements on lower timeframes (i.e., signals from mBDSR).This has been compiled.
Additionally,many are focused on capturing points where multiple entry reasons overlap.There are many.
The explanation usesmore than 1,000 charts.

Method & Case Study (PDF) ★GogoJungle AWARD2020 Winner★
https://www.gogojungle.co.jp/tools/indicators/11836
The above products include 301 PDFs. For a list of their PDF titles and other details, please see the article below.
About the 301 PDF files included with 【BODSOR・mBDSR】
https://www.gogojungle.co.jp/finance/navi/articles/34271
EURJPY 30-minute chart
GBPJPY 30-minute chart
In the 30-minute chart above,the right peak of the double topisthe mBDSR (two RCI lines) return-sell signallighting up and moving down.
From this example,a trading method focused on the double topandthe signals of mBDSRshow a high degree of compatibility.
In such patterns, placing the stop-loss a little above the left peak of the double topallows for favorable risk-reward tradeswith a favorable risk-reward profile.
Indicator that shines in combination with RCI: 【BODSOR・mBDSR】
Method & Case Study (PDF) ★GogoJungle AWARD2020 Winner★
https://www.gogojungle.co.jp/tools/indicators/11836
The PDF files total 301 items (over 1,000 pages, over 350,000 characters).
Most of these are about reasoning how to logically link higher and lower timeframes using three RCI lines, and finally obtaining the timing to buy dips or to sell retracements on lower timeframes (i.e., signals from mBDSR).This has been compiled.
Additionally,many are focused on capturing points where multiple entry reasons overlap.There are many.
The explanation usesmore than 1,000 charts.
× ![]()


