

【Chart Research】Return to the neck line of the double top and the signal of mBDSR (RCI two-filter)
0
Indicator that captures “tops/bottoms and reversals” in combination with RCI【mBDSR】
Methods and Case Studies (PDF) ★GogoJungle AWARD2020 winner★
https://www.gogojungle.co.jp/tools/indicators/11836
The above product includes 301 PDFs. For a list of the titles of those PDFs and other details, please see the article below.
About the 301 PDF files included with 【BODSOR・mBDSR】
https://www.gogojungle.co.jp/finance/navi/articles/34271
USDCAD 4-Hour Chart
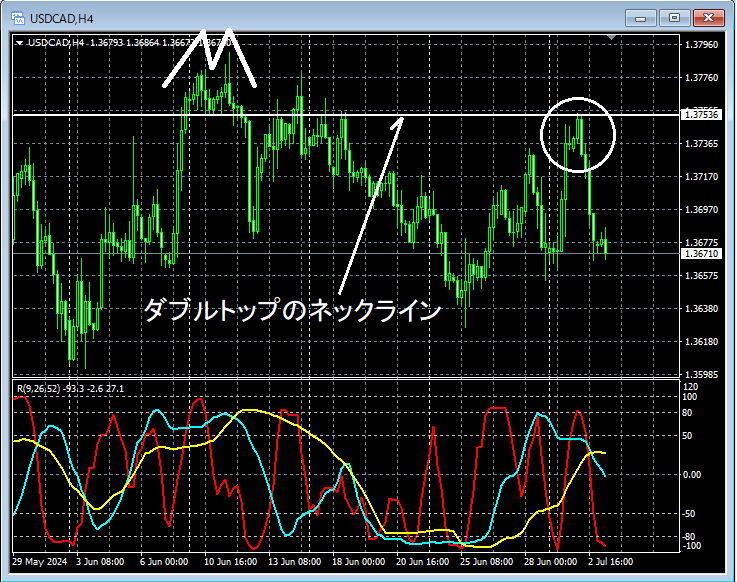
If you look at the area circled by the white circle on the 4-hour chart above,the neckline of the double tophas retraced to near that level, and it might not be unusual to consider a short entry on lower timeframes. Let’s examine that area on the 5-minute chart.
Using the method in the accompanying PDF, RCI is used to descend from higher timeframe (4-hour) to lower timeframes step by step, ultimately bringing it to a setup on the 5-minute chart; the details of this process are omitted. (It is not simply that the 5-minute chart was checked after the 4-hour chart.)
USDCAD 5-Minute Chart
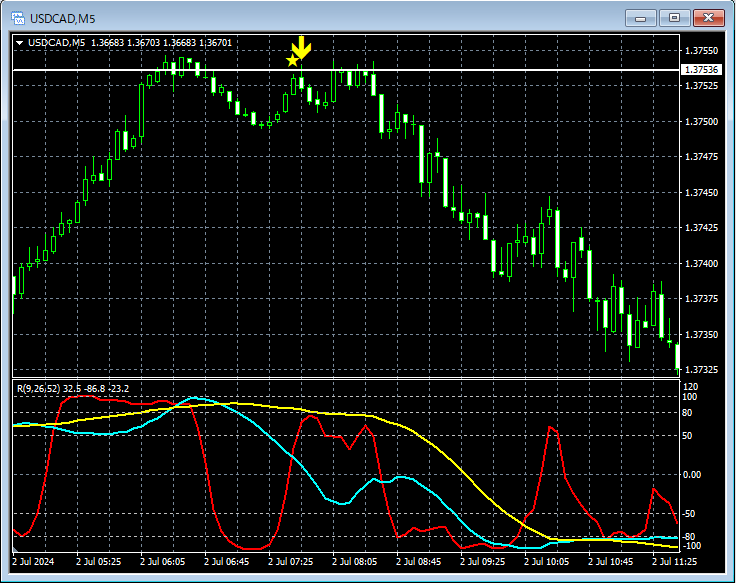
Looking at the above 5-minute chart, around theneckline of the double top on the 4-hour chartareamBDSR (two RCI filters) retracement sell signallights up, and afterwards the price drops significantly.
From this example,a trading method focused on the double-top necklineandthe signals of mBDSRshow high synergy.
Additionally, in this example,placing a stop slightly above the most recent highand so on,enables high risk-reward trades.
Indicator that shines in combination with RCI: 【BODSOR・mBDSR】
Methods and Case Studies (PDF) ★GogoJungle AWARD2020 winner★
https://www.gogojungle.co.jp/tools/indicators/11836
The PDF files amount to 301 in total (over 1,000 pages, over 350,000 words).
Many of them arefocused on logically linking higher and lower timeframes using three RCI lines, examining multiple lower-timeframe conditions step by step, and ultimately waiting for pullback buying or retracement selling timings (i.e., mBDSR signals) on the lower timeframe.
In addition,many emphasize identifying points where multiple entry criteria coincide.
The explanations usemore than 1,000 charts.

Methods and Case Studies (PDF) ★GogoJungle AWARD2020 winner★
https://www.gogojungle.co.jp/tools/indicators/11836
The above product includes 301 PDFs. For a list of the titles of those PDFs and other details, please see the article below.
About the 301 PDF files included with 【BODSOR・mBDSR】
https://www.gogojungle.co.jp/finance/navi/articles/34271
USDCAD 4-Hour Chart
If you look at the area circled by the white circle on the 4-hour chart above,the neckline of the double tophas retraced to near that level, and it might not be unusual to consider a short entry on lower timeframes. Let’s examine that area on the 5-minute chart.
Using the method in the accompanying PDF, RCI is used to descend from higher timeframe (4-hour) to lower timeframes step by step, ultimately bringing it to a setup on the 5-minute chart; the details of this process are omitted. (It is not simply that the 5-minute chart was checked after the 4-hour chart.)
USDCAD 5-Minute Chart
Looking at the above 5-minute chart, around theneckline of the double top on the 4-hour chartareamBDSR (two RCI filters) retracement sell signallights up, and afterwards the price drops significantly.
From this example,a trading method focused on the double-top necklineandthe signals of mBDSRshow high synergy.
Additionally, in this example,placing a stop slightly above the most recent highand so on,enables high risk-reward trades.
Indicator that shines in combination with RCI: 【BODSOR・mBDSR】
Methods and Case Studies (PDF) ★GogoJungle AWARD2020 winner★
https://www.gogojungle.co.jp/tools/indicators/11836
The PDF files amount to 301 in total (over 1,000 pages, over 350,000 words).
Many of them arefocused on logically linking higher and lower timeframes using three RCI lines, examining multiple lower-timeframe conditions step by step, and ultimately waiting for pullback buying or retracement selling timings (i.e., mBDSR signals) on the lower timeframe.
In addition,many emphasize identifying points where multiple entry criteria coincide.
The explanations usemore than 1,000 charts.
× ![]()


