

Yesterday (July 2, 2024)’s USD/JPY 15-minute chart pullback selling point
0
Indicator that captures “top-bottom reversal” when combined with RCI: mBDSR
Methods & Case Studies (PDF) ★GogoJungle AWARD 2020 Winner★
https://www.gogojungle.co.jp/tools/indicators/11836
The above products include 301 PDFs. For a list of the PDF titles and related details, please refer to the article below.
About the 301 PDF files included with 【BODSOR・mBDSR】
https://www.gogojungle.co.jp/finance/navi/articles/34271
Dollar/Yen 15-minute chart
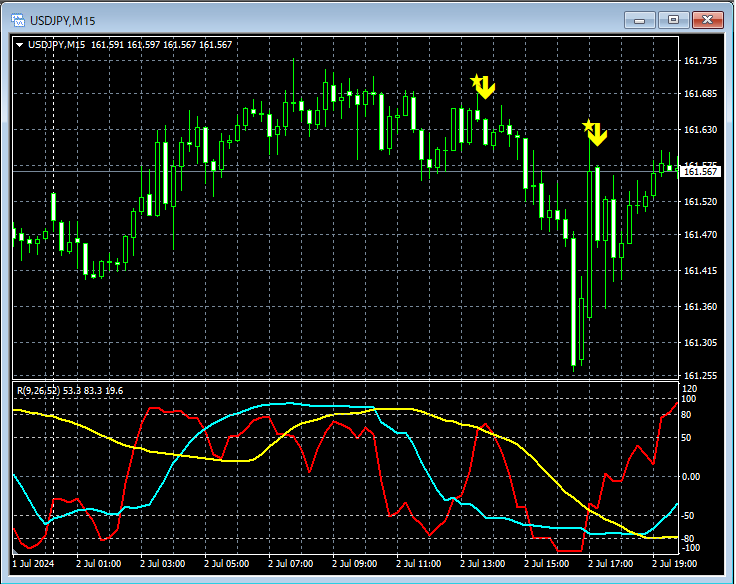
The top timeframe charts are omitted. Using the method in the included PDFs, by applying RCI, the analysis can cascade from higher timeframes (about 4-hour) down to lower timeframes, culminating in waiting for signals on the 15-minute chart.
In the 15-minute chart above, during the decline from the peak areamBDSR (Filter: RCI26 and RCI52) retracement/sell signallights up twice in timely fashion.
Indicator that shines when combined with RCI: 【BODSOR・mBDSR】
Methods & Case Studies (PDF) ★GogoJungle AWARD 2020 Winner★
https://www.gogojungle.co.jp/tools/indicators/11836
The PDF files number 301 (over 1,000 pages, over 350,000 characters in total).
Many of them are examples that summarize a method of logically linking higher and lower timeframes using three RCI lines, then progressively considering multiple lower-timeframe conditions, ultimately waiting for timing on the lower timeframe for a pullback buying or a retracement sell signal (i.e., mBDSR signals).Also,
many focus on identifying points where multiple entry reasons overlap.There are many such cases.
The explanations usemore than 1,000 charts in total..

Methods & Case Studies (PDF) ★GogoJungle AWARD 2020 Winner★
https://www.gogojungle.co.jp/tools/indicators/11836
The above products include 301 PDFs. For a list of the PDF titles and related details, please refer to the article below.
About the 301 PDF files included with 【BODSOR・mBDSR】
https://www.gogojungle.co.jp/finance/navi/articles/34271
Dollar/Yen 15-minute chart
The top timeframe charts are omitted. Using the method in the included PDFs, by applying RCI, the analysis can cascade from higher timeframes (about 4-hour) down to lower timeframes, culminating in waiting for signals on the 15-minute chart.
In the 15-minute chart above, during the decline from the peak areamBDSR (Filter: RCI26 and RCI52) retracement/sell signallights up twice in timely fashion.
Indicator that shines when combined with RCI: 【BODSOR・mBDSR】
Methods & Case Studies (PDF) ★GogoJungle AWARD 2020 Winner★
https://www.gogojungle.co.jp/tools/indicators/11836
The PDF files number 301 (over 1,000 pages, over 350,000 characters in total).
Many of them are examples that summarize a method of logically linking higher and lower timeframes using three RCI lines, then progressively considering multiple lower-timeframe conditions, ultimately waiting for timing on the lower timeframe for a pullback buying or a retracement sell signal (i.e., mBDSR signals).Also,
many focus on identifying points where multiple entry reasons overlap.There are many such cases.
The explanations usemore than 1,000 charts in total..
× ![]()


