

Look for signs of rebound near the moving averages that are considered important [Example of using mBDSR (RCI 2-band filter)]
0
Indicator that captures “tops and bottoms and reversals” in combination with RCI: 【mBDSR】
Method and case studies (PDF) ★GogoJungle AWARD2020 winner★
https://www.gogojungle.co.jp/tools/indicators/11836
The above products include 301 PDFs (methods, case studies, etc.). For a list of the titles of those PDFs, please see the article below.
About the 301 PDF files included with 【BODSOR・mBDSR】
https://www.gogojungle.co.jp/finance/navi/articles/34271
GBPCAD 5-minute chart
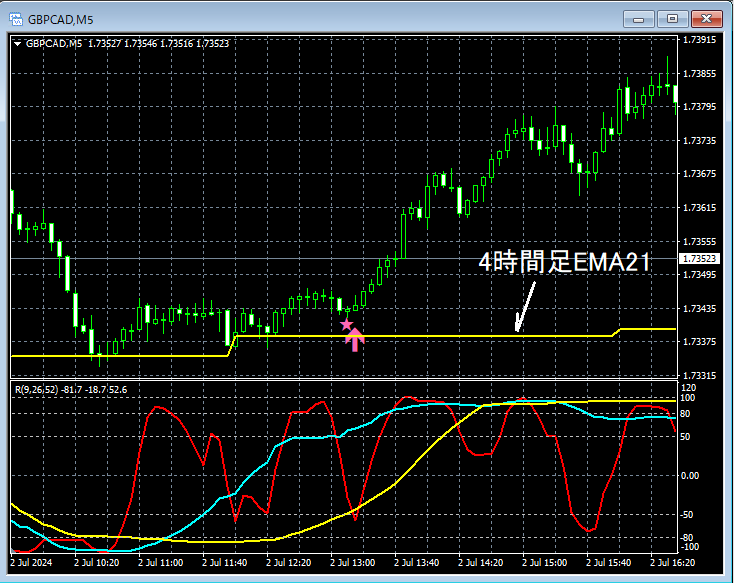
While not detailing the higher timeframe charts, the flow is to consider the higher timeframe situation and aim for a rebound on the lower timeframes. Look for signs of a rebound near important moving averages. In this example,around the 21-period EMA on the 4-hour chartnearbymBDSR (filters: RCI26 and RCI52) pullback buying signallights up and the price rebounds strongly.
From this example,a trading approach focused on rebounds at moving averagesandthe signals of mBDSRshow a high degree of compatibility.
Also, in this example, by placing the stop-loss slightly below the recent low,you can achieve a favorable risk-reward trade.
The indicator 【BODSOR・mBDSR】 that is powerful in combination with RCI
and its method and case studies (PDF) ★GogoJungle AWARD2020 winner★
https://www.gogojungle.co.jp/tools/indicators/11836
The PDF files amount to 301 files (over 1,000 pages, over 350,000 characters in total).
Many of them are abouta framework that uses the three RCI lines to logically link the higher and lower timeframes, sequentially considering the conditions of multiple lower timeframes, and ultimately waiting for pullbacks for example sell/return signals on the lower timeframe (i.e., mBDSR signals).
Additionally,many focus on identifying points where multiple entry reasons overlap..
The explanations useover 1,000 chartsin total.

Method and case studies (PDF) ★GogoJungle AWARD2020 winner★
https://www.gogojungle.co.jp/tools/indicators/11836
The above products include 301 PDFs (methods, case studies, etc.). For a list of the titles of those PDFs, please see the article below.
About the 301 PDF files included with 【BODSOR・mBDSR】
https://www.gogojungle.co.jp/finance/navi/articles/34271
GBPCAD 5-minute chart
While not detailing the higher timeframe charts, the flow is to consider the higher timeframe situation and aim for a rebound on the lower timeframes. Look for signs of a rebound near important moving averages. In this example,around the 21-period EMA on the 4-hour chartnearbymBDSR (filters: RCI26 and RCI52) pullback buying signallights up and the price rebounds strongly.
From this example,a trading approach focused on rebounds at moving averagesandthe signals of mBDSRshow a high degree of compatibility.
Also, in this example, by placing the stop-loss slightly below the recent low,you can achieve a favorable risk-reward trade.
The indicator 【BODSOR・mBDSR】 that is powerful in combination with RCI
and its method and case studies (PDF) ★GogoJungle AWARD2020 winner★
https://www.gogojungle.co.jp/tools/indicators/11836
The PDF files amount to 301 files (over 1,000 pages, over 350,000 characters in total).
Many of them are abouta framework that uses the three RCI lines to logically link the higher and lower timeframes, sequentially considering the conditions of multiple lower timeframes, and ultimately waiting for pullbacks for example sell/return signals on the lower timeframe (i.e., mBDSR signals).
Additionally,many focus on identifying points where multiple entry reasons overlap..
The explanations useover 1,000 chartsin total.
× ![]()


