

[Chart Analysis] Two-bar reversal, engulfing pattern, and harami with mBDSR (RCI two-filter) sell signal
0
Indicator that captures market bottoms and reversals when combined with RCI: 【mBDSR】
Methods and Case Studies (PDF) ★GogoJungle AWARD2020 Recipient★
https://www.gogojungle.co.jp/tools/indicators/11836
The items above include 301 PDFs. For a list of the PDF titles and related information, please see the article below.
Regarding the 301 PDF files included with 【BODSOR・mBDSR】
https://www.gogojungle.co.jp/finance/navi/articles/34271
EURUSD 4-hour chart
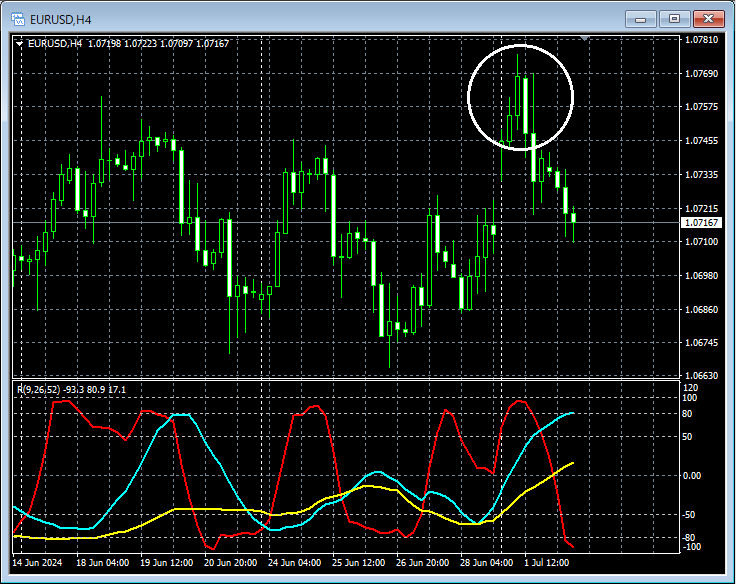
Looking at the area circled in white on the above 4-hour chart, it suggests a downtrendTwo- Bar Reversalhas appeared, and it may not be strange to consider selling on rallies on lower time frames.
EURUSD 1-hour chart
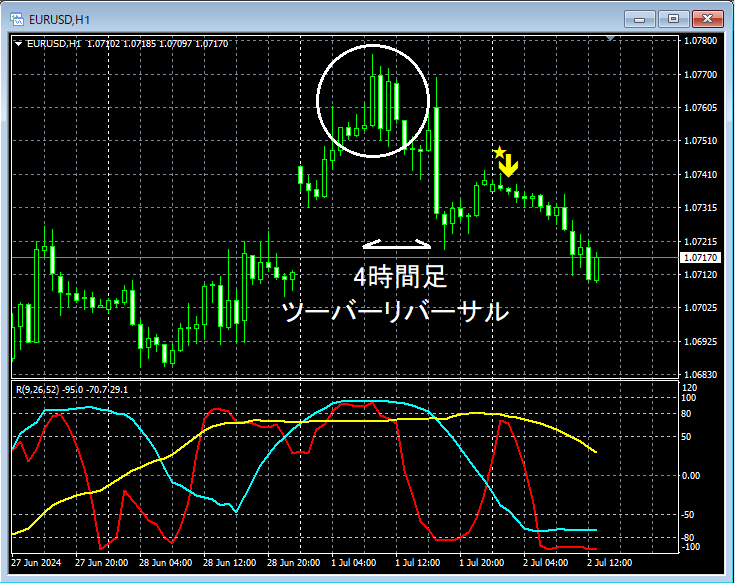
Looking at the above 1-hour chart, it suggests a trend reversalEngulfingandHaramipatterns have continued to appear, and it may be reasonable to consider selling on rallies in this situation. In such circumstances,mBDSR (Filter: RCI26 and RCI52) sell signallights up and the price continues to fall.
From this example,the high compatibility between the Two- Bar Reversal, Engulfing/Harami trading methodsandthe signals of mBDSRis evident.
The indicator 【BODSOR・mBDSR】 that shines when combined with RCI
Methods and Case Studies (PDF) ★GogoJungle AWARD2020 Recipient★
https://www.gogojungle.co.jp/tools/indicators/11836
The PDF files include 301 items (over 1,000 pages in total, over 350,000 characters).
Among them,they are compiled as examples that use three RCI lines to logically link higher and lower time frames, systematically examining the situations of multiple lower-time frames and ultimately waiting for timing to buy on dips or sell on rallies (i.e., signals of mBDSR) on the lower time frames.This is what it contains.
Additionally,many entries focus on capturing points where multiple entry clues coincideas well.
The explanations useover 1,000 chartsin total.

Methods and Case Studies (PDF) ★GogoJungle AWARD2020 Recipient★
https://www.gogojungle.co.jp/tools/indicators/11836
The items above include 301 PDFs. For a list of the PDF titles and related information, please see the article below.
Regarding the 301 PDF files included with 【BODSOR・mBDSR】
https://www.gogojungle.co.jp/finance/navi/articles/34271
EURUSD 4-hour chart
Looking at the area circled in white on the above 4-hour chart, it suggests a downtrendTwo- Bar Reversalhas appeared, and it may not be strange to consider selling on rallies on lower time frames.
EURUSD 1-hour chart
Looking at the above 1-hour chart, it suggests a trend reversalEngulfingandHaramipatterns have continued to appear, and it may be reasonable to consider selling on rallies in this situation. In such circumstances,mBDSR (Filter: RCI26 and RCI52) sell signallights up and the price continues to fall.
From this example,the high compatibility between the Two- Bar Reversal, Engulfing/Harami trading methodsandthe signals of mBDSRis evident.
The indicator 【BODSOR・mBDSR】 that shines when combined with RCI
Methods and Case Studies (PDF) ★GogoJungle AWARD2020 Recipient★
https://www.gogojungle.co.jp/tools/indicators/11836
The PDF files include 301 items (over 1,000 pages in total, over 350,000 characters).
Among them,they are compiled as examples that use three RCI lines to logically link higher and lower time frames, systematically examining the situations of multiple lower-time frames and ultimately waiting for timing to buy on dips or sell on rallies (i.e., signals of mBDSR) on the lower time frames.This is what it contains.
Additionally,many entries focus on capturing points where multiple entry clues coincideas well.
The explanations useover 1,000 chartsin total.
× ![]()


