

【Chart Study】Conspicuous Bottoms on Higher Timeframes and Return-Sell Signals with mBDSR (RCI 2-Filter)
0
Indicator “Capturing Tops and Reversals” in combination with RCI: 【mBDSR】
Methods and Case Studies (PDF) ★GogoJungle AWARD2020 Winner★
https://www.gogojungle.co.jp/tools/indicators/11836
The above product includes 301 PDFs (methods, case studies, etc.). For a list of the titles of those PDFs, please refer to the article below.
About the 301 PDF files included with 【BODSOR・mBDSR】
https://www.gogojungle.co.jp/finance/navi/articles/34271
EURCAD 4-Hour Chart
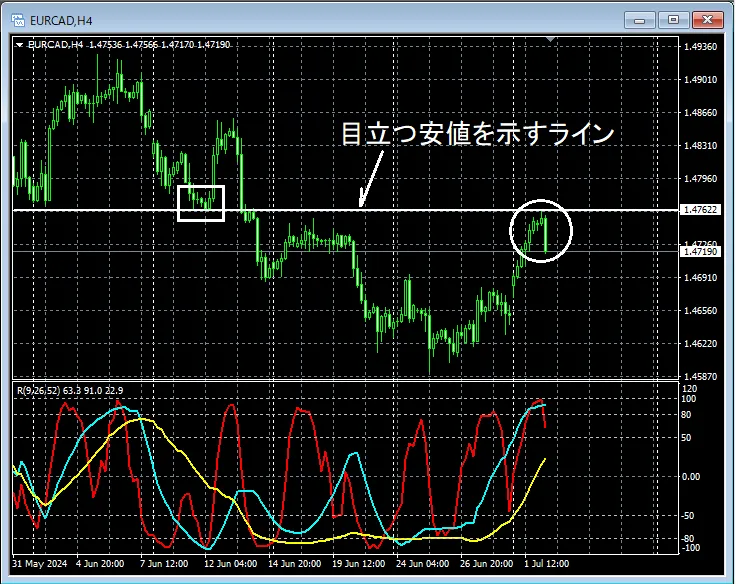
If you look at the area circled with a white circle on the 4-hour chart above,a notable low has risen up close to itIt could also be a scene where a bit of a decline is plausible. While watching the chart, focus on whether there are signs of a drop on lower time frames and monitor the chart’s progression.
Using the method in the included PDF, you can cascade from higher to lower time frames using RCI, but we will omit that here. (This is not simply selecting a 1-minute chart after the 4-hour chart.)
EURCAD 1-Minute Chart
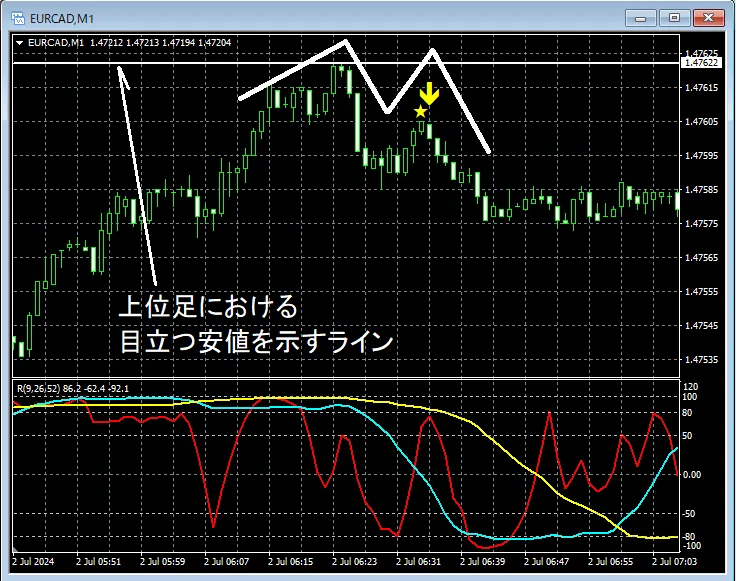
On the above 1-minute chart,a line indicating a past notable lowrises toward and then appears to stall. In the subsequent rebound,the mBDSR (Filter: RCI26 and RCI52) sell signallights up, indicating a well-timed entry for a decline.Right-side peak of a double topis where the sell signal lights up as the price retraces.
From this example,a trading method that focuses on past notable lows and double topsandthe signals of mBDSRappear to have strong compatibility.
Additionally, in this example,placing the stop-loss a little above the recent high (the left peak of the double top)allows for a favorable risk-reward trade.
Indicator 【BODSOR・mBDSR】 that excels in combination with RCI
Methods and Case Studies (PDF) ★GogoJungle AWARD2020 Winner★
https://www.gogojungle.co.jp/tools/indicators/11836
The PDF file set includes 301 files (over 1,000 pages, over 350,000 words in total).
Many of them are focused on constructing a logical link between higher and lower time frames using three RCI lines to progressively analyze multiple lower time frames, ultimately waiting for pullbacks or retracements (i.e., mBDSR signals) on the lower time frame.Also,
There are many such examples.
In the explanations,.

Methods and Case Studies (PDF) ★GogoJungle AWARD2020 Winner★
https://www.gogojungle.co.jp/tools/indicators/11836
The above product includes 301 PDFs (methods, case studies, etc.). For a list of the titles of those PDFs, please refer to the article below.
About the 301 PDF files included with 【BODSOR・mBDSR】
https://www.gogojungle.co.jp/finance/navi/articles/34271
EURCAD 4-Hour Chart
If you look at the area circled with a white circle on the 4-hour chart above,a notable low has risen up close to itIt could also be a scene where a bit of a decline is plausible. While watching the chart, focus on whether there are signs of a drop on lower time frames and monitor the chart’s progression.
Using the method in the included PDF, you can cascade from higher to lower time frames using RCI, but we will omit that here. (This is not simply selecting a 1-minute chart after the 4-hour chart.)
EURCAD 1-Minute Chart
On the above 1-minute chart,a line indicating a past notable lowrises toward and then appears to stall. In the subsequent rebound,the mBDSR (Filter: RCI26 and RCI52) sell signallights up, indicating a well-timed entry for a decline.Right-side peak of a double topis where the sell signal lights up as the price retraces.
From this example,a trading method that focuses on past notable lows and double topsandthe signals of mBDSRappear to have strong compatibility.
Additionally, in this example,placing the stop-loss a little above the recent high (the left peak of the double top)allows for a favorable risk-reward trade.
Indicator 【BODSOR・mBDSR】 that excels in combination with RCI
Methods and Case Studies (PDF) ★GogoJungle AWARD2020 Winner★
https://www.gogojungle.co.jp/tools/indicators/11836
The PDF file set includes 301 files (over 1,000 pages, over 350,000 words in total).
Many of them are focused on constructing a logical link between higher and lower time frames using three RCI lines to progressively analyze multiple lower time frames, ultimately waiting for pullbacks or retracements (i.e., mBDSR signals) on the lower time frame.Also,
There are many such examples.
In the explanations,.
× ![]()


