

A notable low in the higher timeframe and the RCI2 double-filter mBDSR’s selling signal from the recent chart
Indicator 【mBDSR】 that captures the bottom and reversal in combination with RCI
Methods and Case Studies (PDF) ★ GogoJungle AWARD2020 Winner ★
https://www.gogojungle.co.jp/tools/indicators/11836
The above product includes 301 PDFs (methods, case studies, etc.). For a list of the titles of those PDFs, please refer to the article below.
About the 301 PDF files included with 【BODSOR・mBDSR】
https://www.gogojungle.co.jp/finance/navi/articles/34271
NZDCHF 4-hour chart
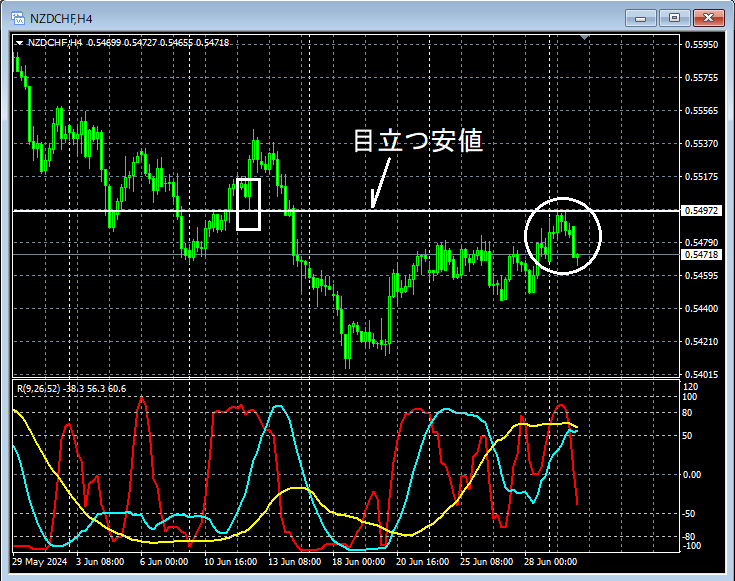
If you look at the area circled by the white circle on the 4-hour chart above,a notable lowappears to have risen up near it. It wouldn’t be surprising to consider a potential further pullback. We will watch the chart by focusing on whether there are any signs of a decline on the lower timeframes.
Using the method in the accompanying PDF, you can apply RCI to progressively drill down from higher to lower timeframes, but that will not be elaborated here. (We are not just casually looking at a 15-minute chart after the 4-hour chart.)
NZDCHF 15-minute chart

On the above 15-minute chart,a line indicating past notable lowsrises and turns down near it. In the subsequent rebound,mBDSR (Filter: RCI26 and RCI52) sell signallights up, and prices subsequently decline steadily.
Here,if the neckline break of a double top is followed by a sell signalon the rebound, that would add another reason to enter.
From this example,a trading method that focuses on past notable lows and double topsandthe signals of mBDSRappear to have a high degree of compatibility.
Indicator 【BODSOR・mBDSR】 that shines when combined with RCI
Methods and Case Studies (PDF) ★ GogoJungle AWARD2020 Winner ★
https://www.gogojungle.co.jp/tools/indicators/11836
The PDF files include 301 items (over 1,000 pages, over 350,000 characters).
Many of themare examples that link multiple higher and lower timeframes logically using three RCI lines, ultimately drilling down to waiting for entry timing on the lower timeframes (i.e., mBDSR signals) such as a buying on dips or selling a pullback.
In addition,many focus on capturing points where multiple entry reasons coincideas well.
Explanation usesmore than 1,000 charts.

Methods and Case Studies (PDF) ★ GogoJungle AWARD2020 Winner ★
https://www.gogojungle.co.jp/tools/indicators/11836
The above product includes 301 PDFs (methods, case studies, etc.). For a list of the titles of those PDFs, please refer to the article below.
About the 301 PDF files included with 【BODSOR・mBDSR】
https://www.gogojungle.co.jp/finance/navi/articles/34271
NZDCHF 4-hour chart
If you look at the area circled by the white circle on the 4-hour chart above,a notable lowappears to have risen up near it. It wouldn’t be surprising to consider a potential further pullback. We will watch the chart by focusing on whether there are any signs of a decline on the lower timeframes.
Using the method in the accompanying PDF, you can apply RCI to progressively drill down from higher to lower timeframes, but that will not be elaborated here. (We are not just casually looking at a 15-minute chart after the 4-hour chart.)
NZDCHF 15-minute chart
On the above 15-minute chart,a line indicating past notable lowsrises and turns down near it. In the subsequent rebound,mBDSR (Filter: RCI26 and RCI52) sell signallights up, and prices subsequently decline steadily.
Here,if the neckline break of a double top is followed by a sell signalon the rebound, that would add another reason to enter.
From this example,a trading method that focuses on past notable lows and double topsandthe signals of mBDSRappear to have a high degree of compatibility.
Indicator 【BODSOR・mBDSR】 that shines when combined with RCI
Methods and Case Studies (PDF) ★ GogoJungle AWARD2020 Winner ★
https://www.gogojungle.co.jp/tools/indicators/11836
The PDF files include 301 items (over 1,000 pages, over 350,000 characters).
Many of themare examples that link multiple higher and lower timeframes logically using three RCI lines, ultimately drilling down to waiting for entry timing on the lower timeframes (i.e., mBDSR signals) such as a buying on dips or selling a pullback.
In addition,many focus on capturing points where multiple entry reasons coincideas well.
Explanation usesmore than 1,000 charts.
× ![]()


