

"Trading method focused on opening windows" and the mBDSR (RCI2-band filter) buy signal on dips
0
Indicator "Capture the Topping/Bottoming" when combined with RCI: 【mBDSR】
Methods & Case Studies (PDF) ★GogoJungle AWARD 2020 winner★
https://www.gogojungle.co.jp/tools/indicators/11836
The above products include 301 PDFs. For a list of their PDF titles, please refer to the article below.
About the 301 PDF files included with 【BODSOR・mBDSR】
https://www.gogojungle.co.jp/finance/navi/articles/34271
Euro/NZD 15-minute chart
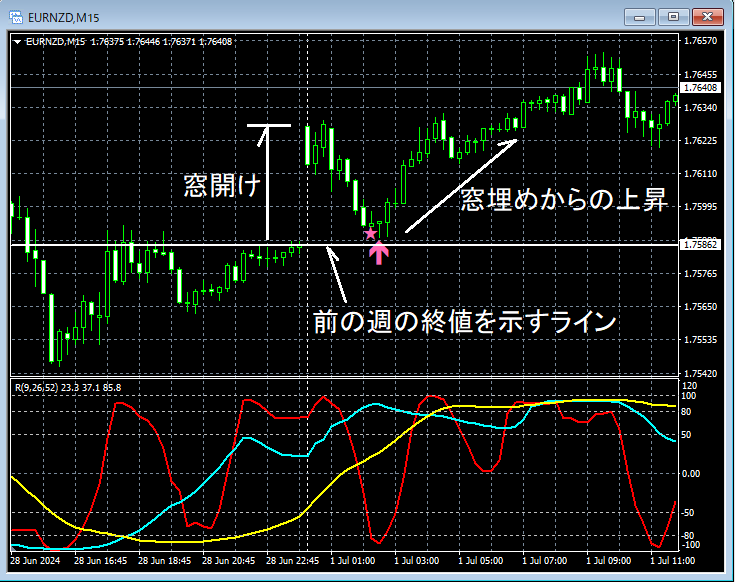
Looking at the 15-minute chart above, you can see agap upoccurring on Monday morning. After that,near the previous week's closeit drops (gap fillis nearly complete)mBDSR (Filter: RCI26 and RCI52) buy-the-dip signallights up and it rises sharply.
Euro/NZD 1-minute chart
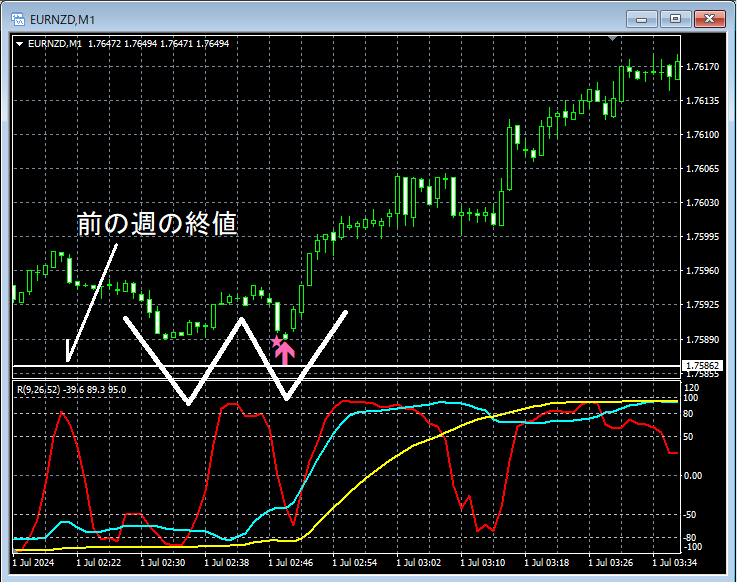
Looking at the 1-minute chart above, after the buy-the-dip signal lights on the 15-minute chart, themBDSR (Filter: RCI26 and RCI52) buy-the-dip signallights up on the 1-minute chart as well and it rises sharply.Right-side trough of the double bottomis where the buy-the-dip signal lights up.
From this example,a trading method focused on the gap-upandthe harmony with mBDSR signalsis evident.
Indicator 【BODSOR・mBDSR】 that shines when combined with RCI
Methods & Case Studies (PDF) ★GogoJungle AWARD2020 winner★
https://www.gogojungle.co.jp/tools/indicators/11836
The PDF files amount to 301 in total (over 1,000 pages, over 350,000 characters).
Many of them are aboutusing the three RCI lines to logically link higher and lower timeframes, sequentially examining the conditions of multiple lower timeframes, and ultimately waiting for the timing of buy-the-dip or selling-pullbacks on the lower timeframes (i.e., the M BDSR signals).This is summarized as the examples.
Additionally,there are many entries focusing on identifying points where multiple entry reasons overlap.More than 1,000 charts are used in the explanations.

Methods & Case Studies (PDF) ★GogoJungle AWARD 2020 winner★
https://www.gogojungle.co.jp/tools/indicators/11836
The above products include 301 PDFs. For a list of their PDF titles, please refer to the article below.
About the 301 PDF files included with 【BODSOR・mBDSR】
https://www.gogojungle.co.jp/finance/navi/articles/34271
Euro/NZD 15-minute chart
Looking at the 15-minute chart above, you can see agap upoccurring on Monday morning. After that,near the previous week's closeit drops (gap fillis nearly complete)mBDSR (Filter: RCI26 and RCI52) buy-the-dip signallights up and it rises sharply.
Euro/NZD 1-minute chart
Looking at the 1-minute chart above, after the buy-the-dip signal lights on the 15-minute chart, themBDSR (Filter: RCI26 and RCI52) buy-the-dip signallights up on the 1-minute chart as well and it rises sharply.Right-side trough of the double bottomis where the buy-the-dip signal lights up.
From this example,a trading method focused on the gap-upandthe harmony with mBDSR signalsis evident.
Indicator 【BODSOR・mBDSR】 that shines when combined with RCI
Methods & Case Studies (PDF) ★GogoJungle AWARD2020 winner★
https://www.gogojungle.co.jp/tools/indicators/11836
The PDF files amount to 301 in total (over 1,000 pages, over 350,000 characters).
Many of them are aboutusing the three RCI lines to logically link higher and lower timeframes, sequentially examining the conditions of multiple lower timeframes, and ultimately waiting for the timing of buy-the-dip or selling-pullbacks on the lower timeframes (i.e., the M BDSR signals).This is summarized as the examples.
Additionally,there are many entries focusing on identifying points where multiple entry reasons overlap.More than 1,000 charts are used in the explanations.
× ![]()


