

Dollar-Yen 1-minute chart support mbDSR (RCI 2-line filter) pullback buy signal - from last Friday's chart -
Indicator in Combination with RCI to Capture Tops and Bottoms and Reversals [mBDSR]
Methods and Case Studies (PDF) ★GogoJungle AWARD2020 Winner★
https://www.gogojungle.co.jp/tools/indicators/11836
The above product includes 301 PDFs. For a list of their PDF titles, please refer to the article below.
About the 301 PDF files accompanying 【BODSOR・mBDSR】
https://www.gogojungle.co.jp/finance/navi/articles/34271
USD/JPY 15-minute chart
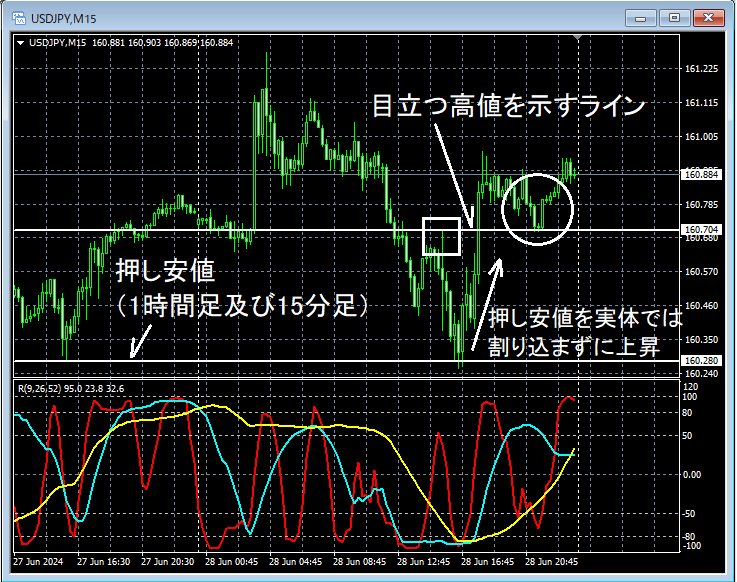
Although the 1-hour chart is omitted, on the 15-minute chart, thepullback lowsdo not break through on the body, and rebound. Around the area encircled with a white circle,a conspicuous high lineis approached, and it might be a scenario where buying on dips on the lower timeframe is not surprising.
USD/JPY 1-minute chart

On the upper 1-minute chart,the line indicating a conspicuous high on the higher timeframehas moved close to itmBDSR (filter: RCI26 and RCI52) dip-buy signalhas lit up and shown a strong rise.
From this example,a trading method focused on high timeframe resistance levelsandthe signals of mBDSRshow a high degree of compatibility.
Additionally, in this example, placing a stop slightly below the recent low enables a favorable risk-reward trade.
Indicator that shines in combination with RCI: 【BODSOR・mBDSR】
Methods and Case Studies (PDF) ★GogoJungle AWARD2020 Winner★
https://www.gogojungle.co.jp/tools/indicators/11836
The PDF files include 301 items (over 1,000 pages, over 350,000 characters in total).
Most of them area collection of examples that logically link higher and lower timeframes using the RCI three-line setup, examining multiple lower-timeframe situations sequentially, and ultimately waiting for pullbacks or reversals on the lower timeframe (i.e., mBDSR signals)..
Also,many of them emphasize identifying points where multiple entry reasons coincide..
The explanations useover 1,000 charts.

Methods and Case Studies (PDF) ★GogoJungle AWARD2020 Winner★
https://www.gogojungle.co.jp/tools/indicators/11836
The above product includes 301 PDFs. For a list of their PDF titles, please refer to the article below.
About the 301 PDF files accompanying 【BODSOR・mBDSR】
https://www.gogojungle.co.jp/finance/navi/articles/34271
USD/JPY 15-minute chart
Although the 1-hour chart is omitted, on the 15-minute chart, thepullback lowsdo not break through on the body, and rebound. Around the area encircled with a white circle,a conspicuous high lineis approached, and it might be a scenario where buying on dips on the lower timeframe is not surprising.
USD/JPY 1-minute chart
On the upper 1-minute chart,the line indicating a conspicuous high on the higher timeframehas moved close to itmBDSR (filter: RCI26 and RCI52) dip-buy signalhas lit up and shown a strong rise.
From this example,a trading method focused on high timeframe resistance levelsandthe signals of mBDSRshow a high degree of compatibility.
Additionally, in this example, placing a stop slightly below the recent low enables a favorable risk-reward trade.
Indicator that shines in combination with RCI: 【BODSOR・mBDSR】
Methods and Case Studies (PDF) ★GogoJungle AWARD2020 Winner★
https://www.gogojungle.co.jp/tools/indicators/11836
The PDF files include 301 items (over 1,000 pages, over 350,000 characters in total).
Most of them area collection of examples that logically link higher and lower timeframes using the RCI three-line setup, examining multiple lower-timeframe situations sequentially, and ultimately waiting for pullbacks or reversals on the lower timeframe (i.e., mBDSR signals)..
Also,many of them emphasize identifying points where multiple entry reasons coincide..
The explanations useover 1,000 charts.
× ![]()


