

【Strongly aware of double bottom in higher timeframes】Buy signal on mBDSR (RCI 2-line filter) for pullback buying
Indicator [mBDSR] that captures bottoms and reversals in combination with RCI
Methods and Case Studies (PDF) ★GogoJungle AWARD2020 winner★
https://www.gogojungle.co.jp/tools/indicators/11836
The above products include 301 PDFs. For a list of the PDF titles and other details, please see the article below.
About the 301 PDF files included with 【BODSOR・mBDSR】
https://www.gogojungle.co.jp/finance/navi/articles/34271
New Zealand yen 1-hour chart
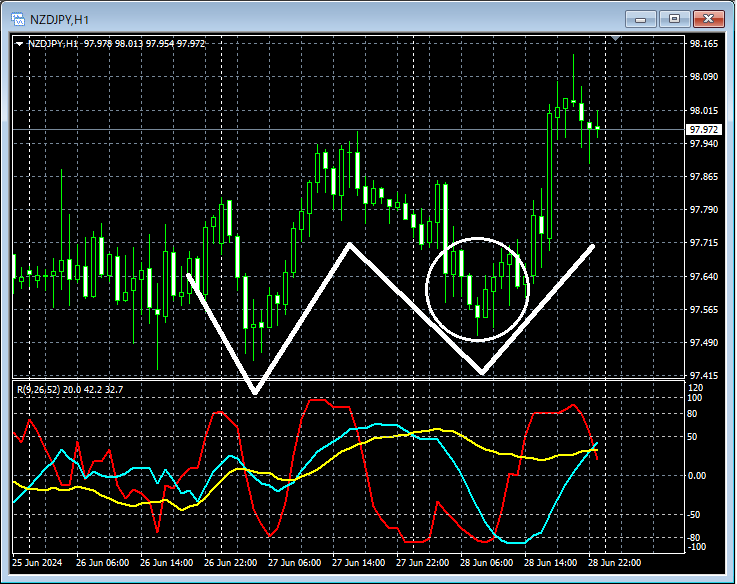
The chart is omitted, but the higher timeframe is strong; on the 1-hour chart above,Double bottomit might not be unusual to consider buying on dips in this scene. We will look at the area circled in white on the lower timeframe.
New Zealand yen 15-minute chart
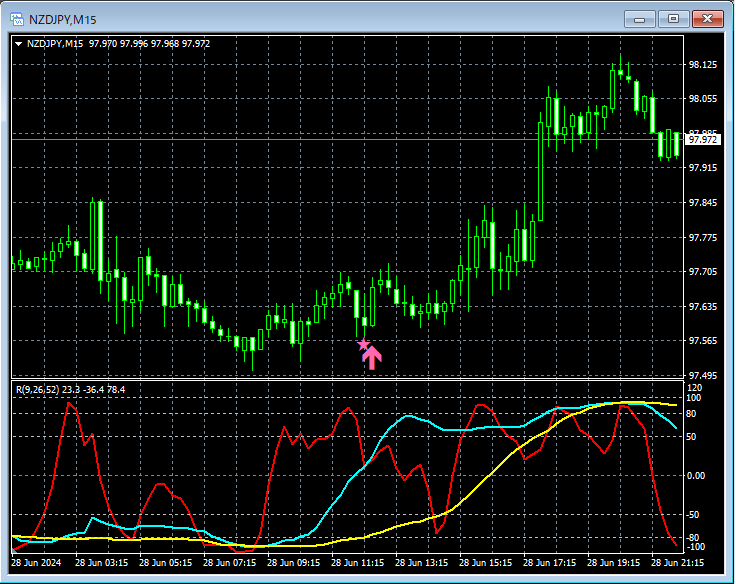
On the upper 15-minute chart,mBDSR (Filter: RCI26 and RCI52) dip-buy signalhas lit up and risen sharply.
From this example,a trading method focusing on the higher-timeframe double bottomandthe signal of mBDSRshow strong harmony.
Additionally, in this example, placing a stop slightly below the recent low allows for a favorable risk-reward trade.
Indicator 【BODSOR・mBDSR】 that shines when combined with RCI
Methods and Case Studies (PDF) ★GogoJungle AWARD2020 winner★
https://www.gogojungle.co.jp/tools/indicators/11836
The PDF files comprise 301 files (over 1,000 pages, over 350,000 words in total).
Many of them examine how to logically link higher and lower timeframes using three RCI lines, and ultimately outline the form of waiting for dip-buying or retracement selling timing (i.e., the mBDSR signals) on the lower timeframes.It is also
primarily focused on capturing points where multiple entry reasons overlapas well.
The explanations usemore than 1,000 chartsin total.

Methods and Case Studies (PDF) ★GogoJungle AWARD2020 winner★
https://www.gogojungle.co.jp/tools/indicators/11836
The above products include 301 PDFs. For a list of the PDF titles and other details, please see the article below.
About the 301 PDF files included with 【BODSOR・mBDSR】
https://www.gogojungle.co.jp/finance/navi/articles/34271
New Zealand yen 1-hour chart
The chart is omitted, but the higher timeframe is strong; on the 1-hour chart above,Double bottomit might not be unusual to consider buying on dips in this scene. We will look at the area circled in white on the lower timeframe.
New Zealand yen 15-minute chart
On the upper 15-minute chart,mBDSR (Filter: RCI26 and RCI52) dip-buy signalhas lit up and risen sharply.
From this example,a trading method focusing on the higher-timeframe double bottomandthe signal of mBDSRshow strong harmony.
Additionally, in this example, placing a stop slightly below the recent low allows for a favorable risk-reward trade.
Indicator 【BODSOR・mBDSR】 that shines when combined with RCI
Methods and Case Studies (PDF) ★GogoJungle AWARD2020 winner★
https://www.gogojungle.co.jp/tools/indicators/11836
The PDF files comprise 301 files (over 1,000 pages, over 350,000 words in total).
Many of them examine how to logically link higher and lower timeframes using three RCI lines, and ultimately outline the form of waiting for dip-buying or retracement selling timing (i.e., the mBDSR signals) on the lower timeframes.It is also
primarily focused on capturing points where multiple entry reasons overlapas well.
The explanations usemore than 1,000 chartsin total.
× ![]()


