

The sense of intervention vigilance in USD/JPY yesterday and the short selling signal from the mBDSR (RCI2 double filter)
Indicator that captures “tops and bottoms and reversals” in combination with RCI: 【mBDSR】
Methods and Case Studies (PDF) ★GogoJungle AWARD 2020 Winner★
https://www.gogojungle.co.jp/tools/indicators/11836
The above product includes 301 PDFs. For a list of the PDFs’ titles and related details, please see the article below.
About the 301 PDF files included with 【BODSOR・mBDSR】
https://www.gogojungle.co.jp/finance/navi/articles/34271
USD/JPY 1-hour chart
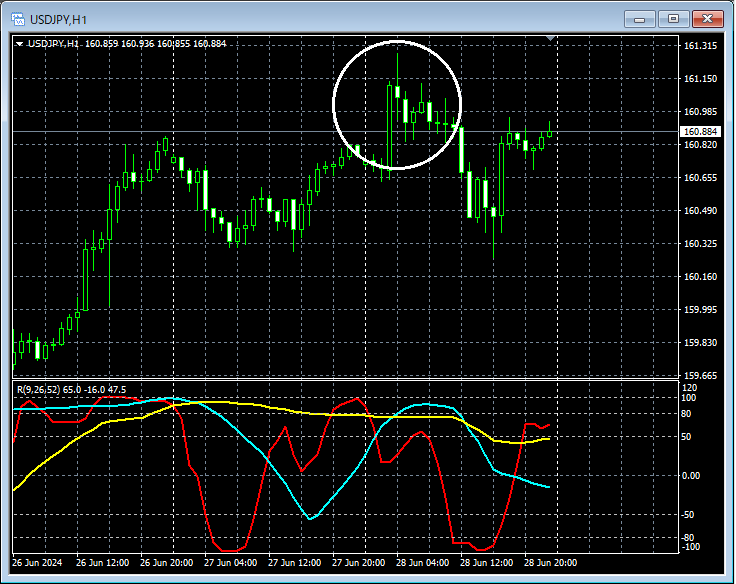
Looking at the area circled in white on the 1-hour chart above, it has risen into the 161 yen range,and the sense of intervention riskis increasing, suggesting a possible moment to watch closely.
USD/JPY 1-minute chart
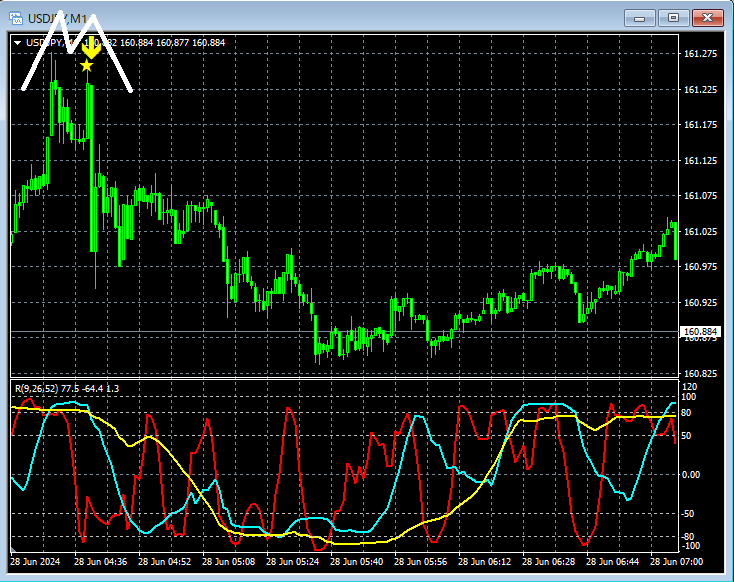
If you look at the 1-minute chart above,a double topis formed and the price is moving lower. Consequently,the timing of the decline on the right peak of the double topis being effectively captured bymBDSR (Filter: RCI26 and RCI52) sell signalwhich is picking up the decline well.
In this example, place the stop loss slightly above theleft peak of the double top (recent high)to keep the stop loss small.
The indicator 【BODSOR・mBDSR】 that shines when combined with RCI
Methods and Case Studies (PDF) ★GogoJungle AWARD 2020 Winner★
https://www.gogojungle.co.jp/tools/indicators/11836
PDF files include 301 items (over 1,000 pages, over 350,000 characters in total).
Many of them are structured to logically link higher and lower timeframes using three RCI lines, examining multiple lower-timeframe conditions sequentially, and ultimately waiting for timing to buy on dips or sell on rallies in the lower timeframe (i.e., the mBDSR signal).This is summarized as the approach taken.
Additionally,many entries focus on overlapping multiple entry reasonsas a priority.
The explanations useover 1,000 chartsin total.

Methods and Case Studies (PDF) ★GogoJungle AWARD 2020 Winner★
https://www.gogojungle.co.jp/tools/indicators/11836
The above product includes 301 PDFs. For a list of the PDFs’ titles and related details, please see the article below.
About the 301 PDF files included with 【BODSOR・mBDSR】
https://www.gogojungle.co.jp/finance/navi/articles/34271
USD/JPY 1-hour chart
Looking at the area circled in white on the 1-hour chart above, it has risen into the 161 yen range,and the sense of intervention riskis increasing, suggesting a possible moment to watch closely.
USD/JPY 1-minute chart
If you look at the 1-minute chart above,a double topis formed and the price is moving lower. Consequently,the timing of the decline on the right peak of the double topis being effectively captured bymBDSR (Filter: RCI26 and RCI52) sell signalwhich is picking up the decline well.
In this example, place the stop loss slightly above theleft peak of the double top (recent high)to keep the stop loss small.
The indicator 【BODSOR・mBDSR】 that shines when combined with RCI
Methods and Case Studies (PDF) ★GogoJungle AWARD 2020 Winner★
https://www.gogojungle.co.jp/tools/indicators/11836
PDF files include 301 items (over 1,000 pages, over 350,000 characters in total).
Many of them are structured to logically link higher and lower timeframes using three RCI lines, examining multiple lower-timeframe conditions sequentially, and ultimately waiting for timing to buy on dips or sell on rallies in the lower timeframe (i.e., the mBDSR signal).This is summarized as the approach taken.
Additionally,many entries focus on overlapping multiple entry reasonsas a priority.
The explanations useover 1,000 chartsin total.
× ![]()


