

Falter/false signal in Elliott Wave and mBDSR (RCI2 two-band filter) bullish entry signal
0
Indicator 【mBDSR】 that captures the bottom and reversal when combined with RCI
Methods, case studies (PDF) ★GogoJungle AWARD2020 winner★
https://www.gogojungle.co.jp/tools/indicators/11836
This article can be seen as a continuation of the article below. For reference.
[Aim for the end of the third wave!!] From yesterday’s EUR/AUD chart
https://www.gogojungle.co.jp/finance/navi/articles/71866
EUR/AUD 1-hour chart
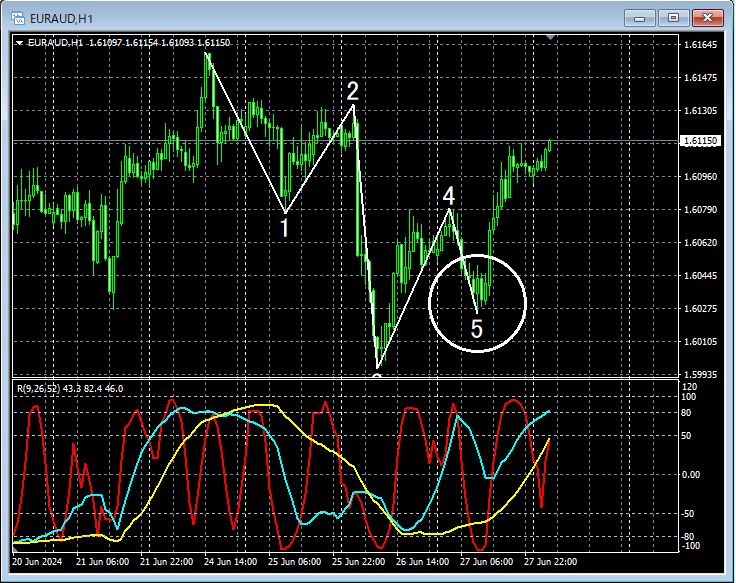
The 1-hour chart above displays the 15-minute Elliott CountElliott count; though omitted on the above chart, considering the Fibonacci retracementFibonacci retracementapplied to Wave 4,the downward 5th wavemay end at a reversalFaleur(likely misspelling in original; intended may be “failure” or “feeler”). It hints at a possible end.
EUR/AUD 5-minute chart
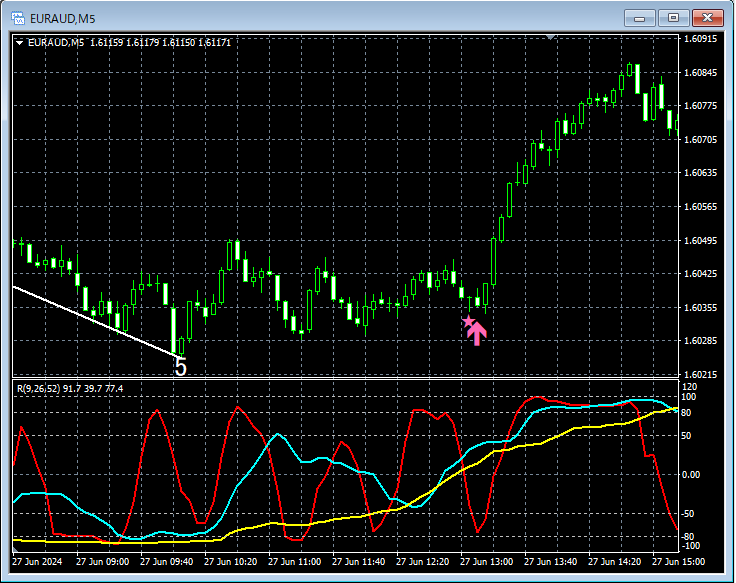
On the above 5-minute chart,downward 5th waveshows a rebound timingmBDSR (Filter: RCI26 and RCI52) pullback-buy signalthat captures the move well.
From this example,a trading method focusing on the end of the Elliott Wave’s final movement (feeler/reversal)andthe signals of mBDSRappear to be highly compatible.
Indicator 【BODSOR・mBDSR】 that shines when combined with RCI
Methods, case studies (PDF) ★GogoJungle AWARD2020 winner★
https://www.gogojungle.co.jp/tools/indicators/11836
The PDF file contains 301 items (over 1,000 pages, over 350,000 characters).
Most of them are gathered as examples that link the higher and lower timeframes logically using three RCI lines, so that multiple lower-timeframe conditions are sequentially analyzed, ultimately waiting for pullbacks or pullbacks (mBDSR signals) on the lower timeframes.Additionally,
Explanation uses.

Methods, case studies (PDF) ★GogoJungle AWARD2020 winner★
https://www.gogojungle.co.jp/tools/indicators/11836
This article can be seen as a continuation of the article below. For reference.
[Aim for the end of the third wave!!] From yesterday’s EUR/AUD chart
https://www.gogojungle.co.jp/finance/navi/articles/71866
EUR/AUD 1-hour chart
The 1-hour chart above displays the 15-minute Elliott CountElliott count; though omitted on the above chart, considering the Fibonacci retracementFibonacci retracementapplied to Wave 4,the downward 5th wavemay end at a reversalFaleur(likely misspelling in original; intended may be “failure” or “feeler”). It hints at a possible end.
EUR/AUD 5-minute chart
On the above 5-minute chart,downward 5th waveshows a rebound timingmBDSR (Filter: RCI26 and RCI52) pullback-buy signalthat captures the move well.
From this example,a trading method focusing on the end of the Elliott Wave’s final movement (feeler/reversal)andthe signals of mBDSRappear to be highly compatible.
Indicator 【BODSOR・mBDSR】 that shines when combined with RCI
Methods, case studies (PDF) ★GogoJungle AWARD2020 winner★
https://www.gogojungle.co.jp/tools/indicators/11836
The PDF file contains 301 items (over 1,000 pages, over 350,000 characters).
Most of them are gathered as examples that link the higher and lower timeframes logically using three RCI lines, so that multiple lower-timeframe conditions are sequentially analyzed, ultimately waiting for pullbacks or pullbacks (mBDSR signals) on the lower timeframes.Additionally,
Explanation uses.
× ![]()


