

[Chart Study] Neckline and mBDSR (RCI 2-band filter) Rebound Sell Signal
0
An Indicator that Captures Tops, Bottoms, and Reversals in Combination with RCI【mBDSR】
Method and Case Study (PDF) ★GogoJungle AWARD2020 recipient★
https://www.gogojungle.co.jp/tools/indicators/11836
The above products include 301 PDFs. For a list of the PDF titles and related information, please see the article below.
About the 301 PDF files included with 【BODSOR・mBDSR】
https://www.gogojungle.co.jp/finance/navi/articles/34271
AUDNZD Daily
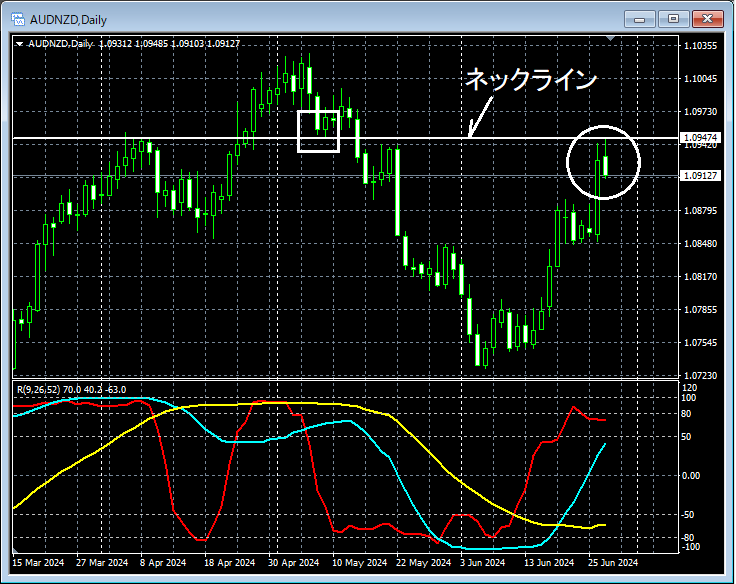
If you look at the area circled in white on the daily chart aboveNecklineit has risen toward the vicinity, and it may not be strange to consider selling on rebounds on lower timeframes.
AUDNZD 5-minute
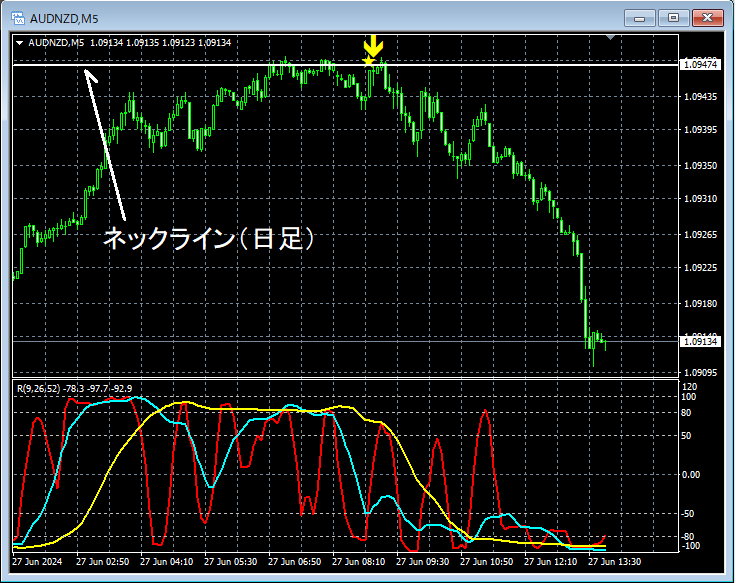
On the upper 5-minute chartNeckline (Daily)rising toward the vicinity,mBDSR (Filter: RCI26 and RCI52) Rebound Sell Signallights up and prices go down.
From this example,a trading method focused on the higher-timeframe neck lineandthe compatibility with mBDSR signalsare evident.
Also, in this example, by placing the stop loss slightly above the most recent highthe potential for a favorable risk-reward tradeis increased.
An indicator that shines when used in combination with RCI【BODSOR・mBDSR】
Method and Case Study (PDF) ★GogoJungle AWARD2020 recipient★
https://www.gogojungle.co.jp/tools/indicators/11836
The PDF files include 301 items (over 1,000 pages, over 350,000 words in total).
Many of them describe a method that logically links the higher timeframe and lower timeframe using the 3-line RCI, examining multiple lower timeframes sequentially and finally waiting for timing signals on the lower timeframe for a buying the dip or selling the rebound (i.e., the mBDSR signal).
There are many such cases.
The explanation uses.

Method and Case Study (PDF) ★GogoJungle AWARD2020 recipient★
https://www.gogojungle.co.jp/tools/indicators/11836
The above products include 301 PDFs. For a list of the PDF titles and related information, please see the article below.
About the 301 PDF files included with 【BODSOR・mBDSR】
https://www.gogojungle.co.jp/finance/navi/articles/34271
AUDNZD Daily
If you look at the area circled in white on the daily chart aboveNecklineit has risen toward the vicinity, and it may not be strange to consider selling on rebounds on lower timeframes.
AUDNZD 5-minute
On the upper 5-minute chartNeckline (Daily)rising toward the vicinity,mBDSR (Filter: RCI26 and RCI52) Rebound Sell Signallights up and prices go down.
From this example,a trading method focused on the higher-timeframe neck lineandthe compatibility with mBDSR signalsare evident.
Also, in this example, by placing the stop loss slightly above the most recent highthe potential for a favorable risk-reward tradeis increased.
An indicator that shines when used in combination with RCI【BODSOR・mBDSR】
Method and Case Study (PDF) ★GogoJungle AWARD2020 recipient★
https://www.gogojungle.co.jp/tools/indicators/11836
The PDF files include 301 items (over 1,000 pages, over 350,000 words in total).
Many of them describe a method that logically links the higher timeframe and lower timeframe using the 3-line RCI, examining multiple lower timeframes sequentially and finally waiting for timing signals on the lower timeframe for a buying the dip or selling the rebound (i.e., the mBDSR signal).
There are many such cases.
The explanation uses.
× ![]()


