

[Aiming for Trend Reversal!!] Today's Gold (XAUUSD) chart as of June 27, 2024
0
An Indicator that Captures Tops/Bottoms with the Combination of RCI【mBDSR】
Methods and Case Studies (PDF) ★GogoJungle AWARD2020 Winner★
https://www.gogojungle.co.jp/tools/indicators/11836
The above products include 301 PDF files. For a list of their PDF titles, please see the article below.
About the 301 PDF files included with 【BODSOR・mBDSR】
https://www.gogojungle.co.jp/finance/navi/articles/34271
Gold XAUUSD 15-minute chart
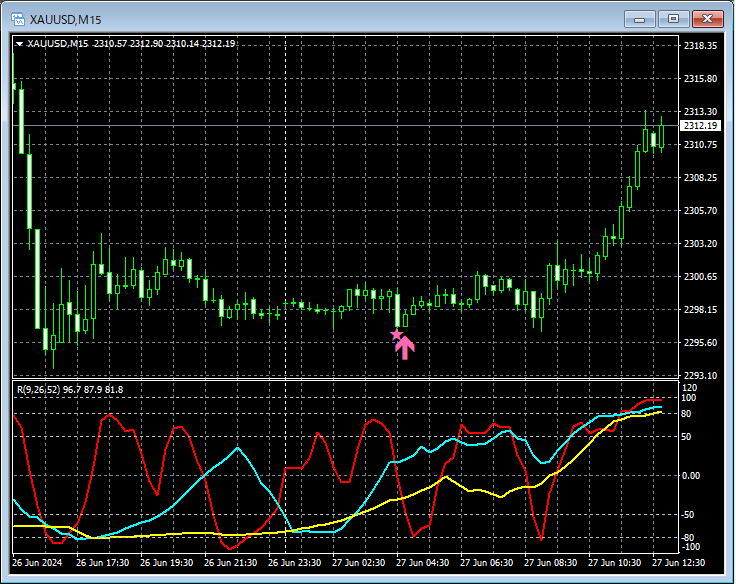
Regarding the higher time frame, the pattern is common and will be omitted here. The explanation for linking higher time frames to lower time frames will be referred to in the included PDF.
On the 15-minute chart above,mBDSR (Filter: RCI26 and RCI52) pullback buy signallights up, and then it rises significantly.
An indicator that shines with the combination of RCI: 【BODSOR・mBDSR】
Methods and Case Studies (PDF) ★GogoJungle AWARD2020 Winner★
https://www.gogojungle.co.jp/tools/indicators/11836
The PDF files include 301 files (over 1,000 pages, over 350,000 characters in total).
Many of them areexamples that break down the process of logically linking higher and lower time frames using three RCI lines, and ultimately waiting for pullbacks or rebounds signals on the lower time frame (i.e., mBDSR signals).This is what they amount to.
Also,many of them focus on capturing points where multiple entry reasons overlap.There are many.
In the explanations,over 1,000 chartsare used.

Methods and Case Studies (PDF) ★GogoJungle AWARD2020 Winner★
https://www.gogojungle.co.jp/tools/indicators/11836
The above products include 301 PDF files. For a list of their PDF titles, please see the article below.
About the 301 PDF files included with 【BODSOR・mBDSR】
https://www.gogojungle.co.jp/finance/navi/articles/34271
Gold XAUUSD 15-minute chart
Regarding the higher time frame, the pattern is common and will be omitted here. The explanation for linking higher time frames to lower time frames will be referred to in the included PDF.
On the 15-minute chart above,mBDSR (Filter: RCI26 and RCI52) pullback buy signallights up, and then it rises significantly.
An indicator that shines with the combination of RCI: 【BODSOR・mBDSR】
Methods and Case Studies (PDF) ★GogoJungle AWARD2020 Winner★
https://www.gogojungle.co.jp/tools/indicators/11836
The PDF files include 301 files (over 1,000 pages, over 350,000 characters in total).
Many of them areexamples that break down the process of logically linking higher and lower time frames using three RCI lines, and ultimately waiting for pullbacks or rebounds signals on the lower time frame (i.e., mBDSR signals).This is what they amount to.
Also,many of them focus on capturing points where multiple entry reasons overlap.There are many.
In the explanations,over 1,000 chartsare used.
× ![]()


