

Aim to take advantage of gold's decline!! From the chart two days ago
Indicator "Capturing the Bottom/Top Reversal" in combination with RCI【mBDSR】
Methods and Case Studies (PDF) ★GogoJungle AWARD2020 Winner★
https://www.gogojungle.co.jp/tools/indicators/11836
The above product includes 301 PDFs. For a list of their PDF titles and related information, please see the article below.
About the 301 PDF files included with 【BODSOR・mBDSR】
https://www.gogojungle.co.jp/finance/navi/articles/34271
Gold XAUUSD 4-hour chart
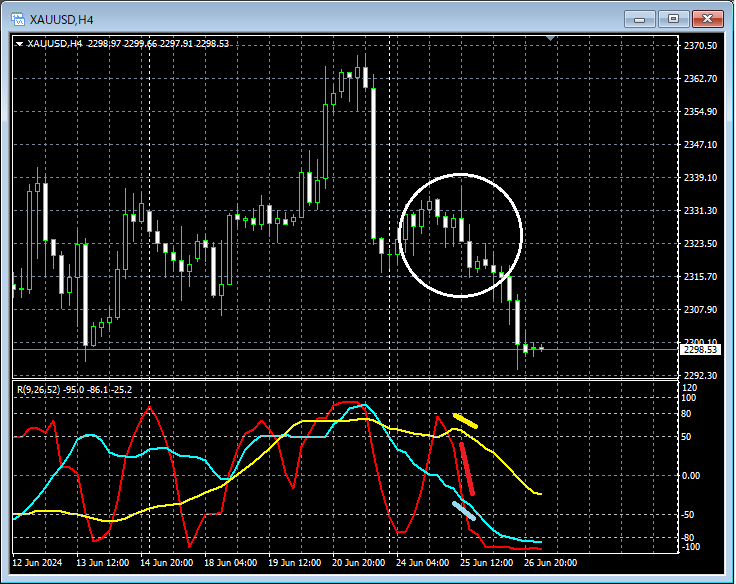
Looking at the area circled by the white circle on the 4-hour chart above,three RCI lines align and head downwardindicating a very weak formation, and it could be reasonable to target a pullback selling on lower timeframes.
Gold XAUUSD 15-minute chart
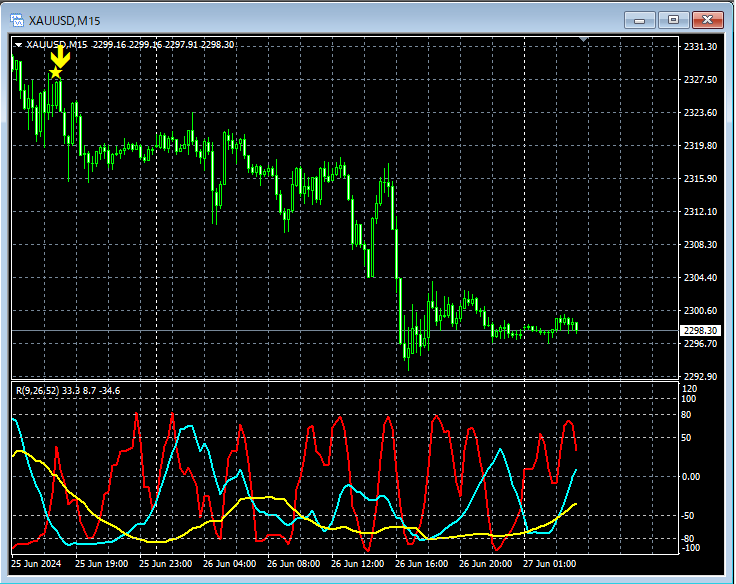
On the 15-minute chart above,mBDSR (Filter: RCI26 and RCI52) sell signalis lit, and as a result, prices drop notably after the signal, but here we will also look at even lower timeframes.
Gold XAUUSD 1-minute chart
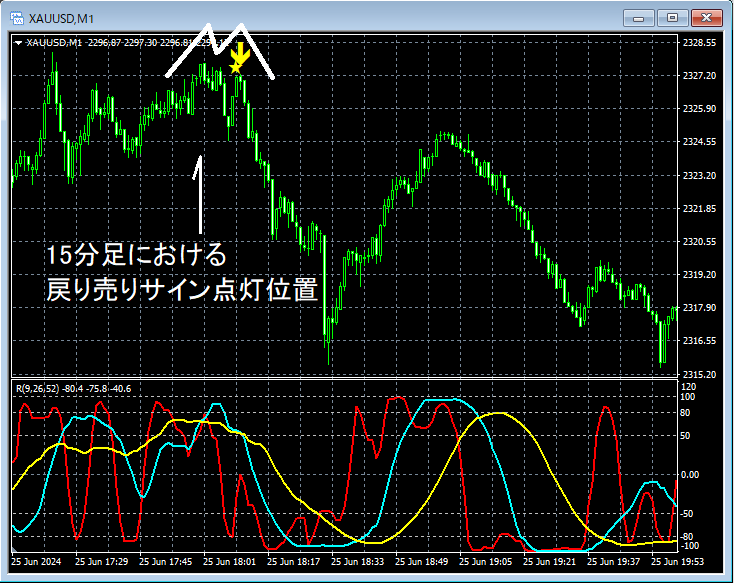
On the 1-minute chart above, after the 15-minute sell signal lights up,a double topforms and prices fall sharply. Consequently,the mBDSR (Filter: RCI26 and RCI52) sell signallights upon the right-hand peak of the double topand the right top that forms the shape.
From this example,a trading method that focuses on the upper-timeframe RCI three-line ensemble and the double topandthe signals of mBDSRshow high compatibility.
Also, in this example, placing the stop loss slightly above the left peak of the double topcan create a trade with favorable risk-reward dynamicsand high edge.
Indicator that shines in combination with RCI: 【BODSOR・mBDSR】
Methods and Case Studies (PDF) ★GogoJungle AWARD2020 Winner★
https://www.gogojungle.co.jp/tools/indicators/11836
The PDF files number 301 (over 1,000 pages, over 350,000 words in total).
Many of them are a compilation of examples that logically link higher and lower timeframes using the three-line RCI, then sequentially consider the various lower-timeframe situations and ultimately wait for pullbacks/buying on dips or pullback selling on lower timeframes (i.e., mBDSR signals).In addition,
there is a strong emphasis on identifying points where multiple entry reasons overlapas well.
The explanations usemore than 1,000 charts.

Methods and Case Studies (PDF) ★GogoJungle AWARD2020 Winner★
https://www.gogojungle.co.jp/tools/indicators/11836
The above product includes 301 PDFs. For a list of their PDF titles and related information, please see the article below.
About the 301 PDF files included with 【BODSOR・mBDSR】
https://www.gogojungle.co.jp/finance/navi/articles/34271
Gold XAUUSD 4-hour chart
Looking at the area circled by the white circle on the 4-hour chart above,three RCI lines align and head downwardindicating a very weak formation, and it could be reasonable to target a pullback selling on lower timeframes.
Gold XAUUSD 15-minute chart
On the 15-minute chart above,mBDSR (Filter: RCI26 and RCI52) sell signalis lit, and as a result, prices drop notably after the signal, but here we will also look at even lower timeframes.
Gold XAUUSD 1-minute chart
On the 1-minute chart above, after the 15-minute sell signal lights up,a double topforms and prices fall sharply. Consequently,the mBDSR (Filter: RCI26 and RCI52) sell signallights upon the right-hand peak of the double topand the right top that forms the shape.
From this example,a trading method that focuses on the upper-timeframe RCI three-line ensemble and the double topandthe signals of mBDSRshow high compatibility.
Also, in this example, placing the stop loss slightly above the left peak of the double topcan create a trade with favorable risk-reward dynamicsand high edge.
Indicator that shines in combination with RCI: 【BODSOR・mBDSR】
Methods and Case Studies (PDF) ★GogoJungle AWARD2020 Winner★
https://www.gogojungle.co.jp/tools/indicators/11836
The PDF files number 301 (over 1,000 pages, over 350,000 words in total).
Many of them are a compilation of examples that logically link higher and lower timeframes using the three-line RCI, then sequentially consider the various lower-timeframe situations and ultimately wait for pullbacks/buying on dips or pullback selling on lower timeframes (i.e., mBDSR signals).In addition,
there is a strong emphasis on identifying points where multiple entry reasons overlapas well.
The explanations usemore than 1,000 charts.
× ![]()


