

【Aim to end the 第3波 (third wave)!!】From yesterday's EUR/AUD chart
0
An Indicator that Captures Tops/Bottoms with RCI: The mBDSR
Method and Case Studies (PDF) ★GogoJungle AWARD2020 Winner★
https://www.gogojungle.co.jp/tools/indicators/11836
The above products include 301 PDF files. For a list of those PDFs' titles, please refer to the article below.
About the 301 PDF files included with 【BODSOR・mBDSR】
https://www.gogojungle.co.jp/finance/navi/articles/34271
【Special Video】 First Session (with Viewing Privilege Special Indicator)
https://www.gogojungle.co.jp/finance/navi/articles/70917
【Special Video】 Second Session
https://www.gogojungle.co.jp/finance/navi/articles/71083
【Special Video】 Third Session
https://www.gogojungle.co.jp/finance/navi/articles/71151
EUR/GBP One Hour Chart
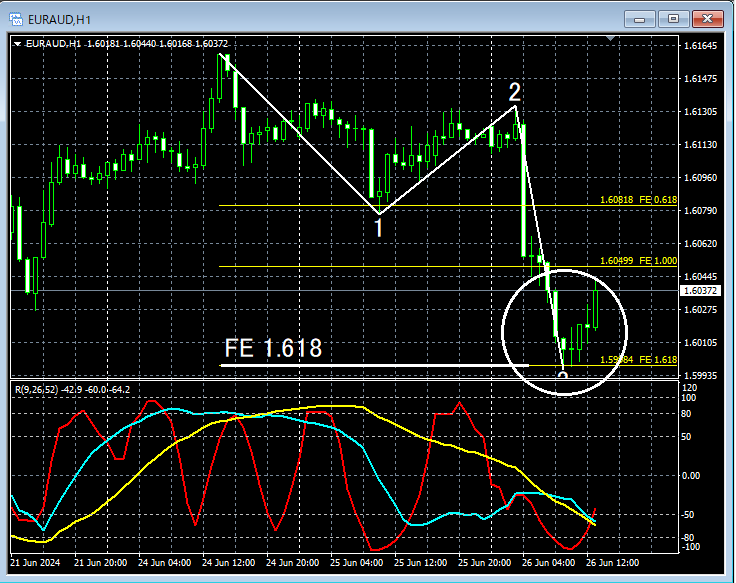
If you look at the area encircled by the white circle on the one-hour chart above,Fibonacci Expansion 1.618appears to have been pulled down toward the vicinity,potential end of the 3rd downward wavethus making it not unreasonable to anticipate a reversal to the upside. (Note: the chart above is on a 1-hour timeframe, but the Elliott count is based on a 15-minute chart.)
EUR/GBP 15-Minute Chart
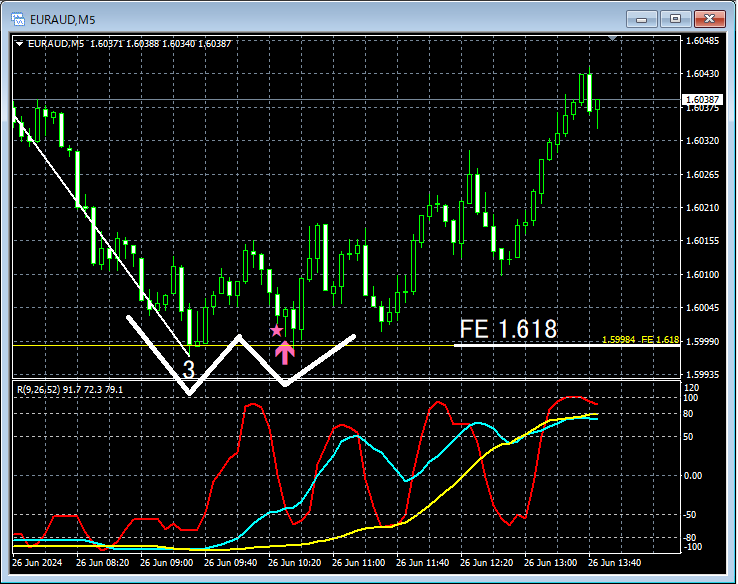
On the 15-minute chart above,Fibonacci Expansion 1.618nearby,a Double Bottomis forming and rising. In this case,the timing of the rise at the right leg of the double bottomis well captured bymBDSR (Filter: RCI26 and RCI52) pullback buy signal. This can be observed clearly.
From this example,a trading method focusing on the end of the 3rd wave or a double bottomandthe signal of mBDSRshow a high level of compatibility.
Also in this example, by placing the stop loss slightly below the right-side valley of the double topyou can achieve a high risk-reward favorable trade.
An indicator that excels in combination with RCI: 【BODSOR・mBDSR】
Method and Case Studies (PDF) ★GogoJungle AWARD2020 Winner★
https://www.gogojungle.co.jp/tools/indicators/11836
The PDF files total 301 (over 1,000 pages, over 350,000 characters).
Many of them are about the example of logically linking multiple lower timeframes by using three RCI lines on the higher timeframe, and ultimately waiting for pullbacks or retracements on the lower timeframe signals (i.e., mBDSR signals).They also focus on identifying points where multiple entry reasons coincide.
The explanations useover 1,000 charts..

Method and Case Studies (PDF) ★GogoJungle AWARD2020 Winner★
https://www.gogojungle.co.jp/tools/indicators/11836
The above products include 301 PDF files. For a list of those PDFs' titles, please refer to the article below.
About the 301 PDF files included with 【BODSOR・mBDSR】
https://www.gogojungle.co.jp/finance/navi/articles/34271
【Special Video】 First Session (with Viewing Privilege Special Indicator)
https://www.gogojungle.co.jp/finance/navi/articles/70917
【Special Video】 Second Session
https://www.gogojungle.co.jp/finance/navi/articles/71083
【Special Video】 Third Session
https://www.gogojungle.co.jp/finance/navi/articles/71151
EUR/GBP One Hour Chart
If you look at the area encircled by the white circle on the one-hour chart above,Fibonacci Expansion 1.618appears to have been pulled down toward the vicinity,potential end of the 3rd downward wavethus making it not unreasonable to anticipate a reversal to the upside. (Note: the chart above is on a 1-hour timeframe, but the Elliott count is based on a 15-minute chart.)
EUR/GBP 15-Minute Chart
On the 15-minute chart above,Fibonacci Expansion 1.618nearby,a Double Bottomis forming and rising. In this case,the timing of the rise at the right leg of the double bottomis well captured bymBDSR (Filter: RCI26 and RCI52) pullback buy signal. This can be observed clearly.
From this example,a trading method focusing on the end of the 3rd wave or a double bottomandthe signal of mBDSRshow a high level of compatibility.
Also in this example, by placing the stop loss slightly below the right-side valley of the double topyou can achieve a high risk-reward favorable trade.
An indicator that excels in combination with RCI: 【BODSOR・mBDSR】
Method and Case Studies (PDF) ★GogoJungle AWARD2020 Winner★
https://www.gogojungle.co.jp/tools/indicators/11836
The PDF files total 301 (over 1,000 pages, over 350,000 characters).
Many of them are about the example of logically linking multiple lower timeframes by using three RCI lines on the higher timeframe, and ultimately waiting for pullbacks or retracements on the lower timeframe signals (i.e., mBDSR signals).They also focus on identifying points where multiple entry reasons coincide.
The explanations useover 1,000 charts..
× ![]()


