

[Chart Study] Inverse Head and Shoulders Neckline and mBDSR (RCI two-line filter) Buy Signal on Pullback
0
Indicator to Capture Bottom and Reversal in Combination with RCI: 【mBDSR】
Method and Case Studies (PDF) ★GogoJungle AWARD 2020 Winner★
https://www.gogojungle.co.jp/tools/indicators/11836
The above product includes 301 PDFs. For a list of the PDF titles and related details, please refer to the article below.
About the 301 PDF files included with 【BODSOR・mBDSR】
https://www.gogojungle.co.jp/finance/navi/articles/34271
Pound Swiss 4-hour chart
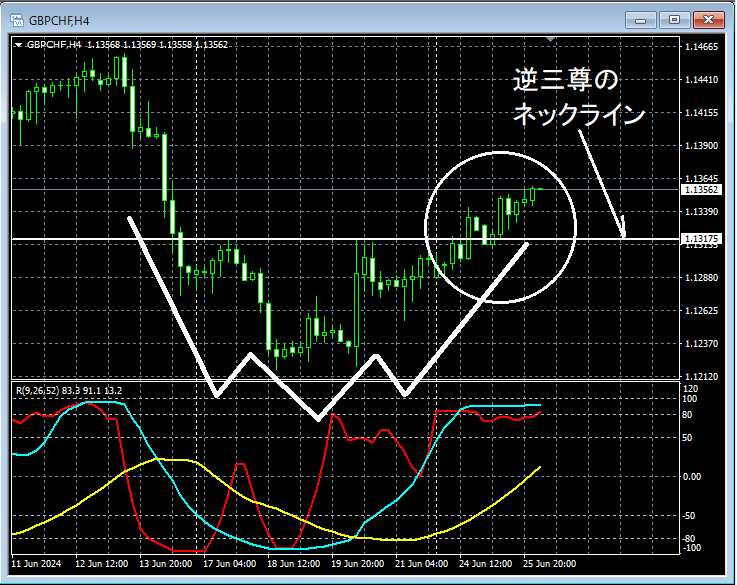
Looking at the 4-hour chart above,an Inverse Head and Shouldersis forming. Also, near the area circled with a white circle,the neck line of the inverse head and shouldershas been pushed down, and it may not be unusual to consider a buying opportunity on a lower time frame.
Pound Swiss 15-minute chart
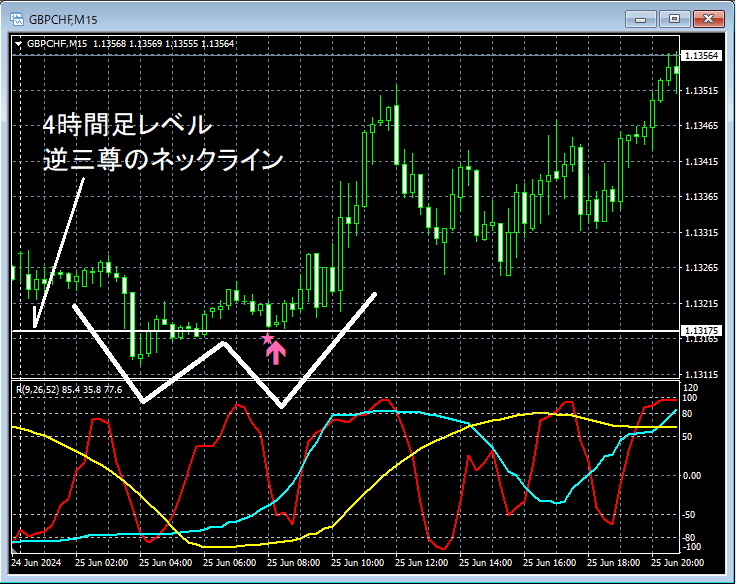
On the 15-minute chart above,the neck line of the inverse head and shoulders at the 4-hour levelis neara double bottomis forming. And, therise timing at the right side of the double bottomis captured well bymBDSR (Filter: RCI26 and RCI52) pullback buy signalas seen.
From this example,a trading method focusing on the neck line of the inverse head and shoulders and the double bottomandthe signals of mBDSRshow a strong compatibility.
Also, in this example, placing the stop loss just below the recent swing lowto achieve favorable risk-rewardmakes for a high-probability trade.
Indicator with powerful performance in combination with RCI: 【BODSOR・mBDSR】
Method and Case Studies (PDF) ★GogoJungle AWARD 2020 Winner★
https://www.gogojungle.co.jp/tools/indicators/11836
The PDF files include 301 items (over 1,000 pages, over 350,000 characters in total).
Most of them are about summarizing examples that decompose the process of logically linking higher and lower timeframes using three RCI lines to analyze multiple lower timeframes step by step, ultimately waiting for pullbacks or retracements signals (i.e., mBDSR signals) on the lower timeframes.
Additionally,many of them emphasize identifying points where multiple entry reasons coincide.There are also many cases.
The explanations usemore than 1,000 charts.

Method and Case Studies (PDF) ★GogoJungle AWARD 2020 Winner★
https://www.gogojungle.co.jp/tools/indicators/11836
The above product includes 301 PDFs. For a list of the PDF titles and related details, please refer to the article below.
About the 301 PDF files included with 【BODSOR・mBDSR】
https://www.gogojungle.co.jp/finance/navi/articles/34271
Pound Swiss 4-hour chart
Looking at the 4-hour chart above,an Inverse Head and Shouldersis forming. Also, near the area circled with a white circle,the neck line of the inverse head and shouldershas been pushed down, and it may not be unusual to consider a buying opportunity on a lower time frame.
Pound Swiss 15-minute chart
On the 15-minute chart above,the neck line of the inverse head and shoulders at the 4-hour levelis neara double bottomis forming. And, therise timing at the right side of the double bottomis captured well bymBDSR (Filter: RCI26 and RCI52) pullback buy signalas seen.
From this example,a trading method focusing on the neck line of the inverse head and shoulders and the double bottomandthe signals of mBDSRshow a strong compatibility.
Also, in this example, placing the stop loss just below the recent swing lowto achieve favorable risk-rewardmakes for a high-probability trade.
Indicator with powerful performance in combination with RCI: 【BODSOR・mBDSR】
Method and Case Studies (PDF) ★GogoJungle AWARD 2020 Winner★
https://www.gogojungle.co.jp/tools/indicators/11836
The PDF files include 301 items (over 1,000 pages, over 350,000 characters in total).
Most of them are about summarizing examples that decompose the process of logically linking higher and lower timeframes using three RCI lines to analyze multiple lower timeframes step by step, ultimately waiting for pullbacks or retracements signals (i.e., mBDSR signals) on the lower timeframes.
Additionally,many of them emphasize identifying points where multiple entry reasons coincide.There are also many cases.
The explanations usemore than 1,000 charts.
× ![]()


