

[Aim for the third wave!!] From yesterday's Gold (XAUUSD) chart
0
Indicator to Capture Troughs and Reversals in Combination with RCI: 【mBDSR】
Methods and Case Studies (PDF) ★GogoJungle AWARD 2020 Winner★
https://www.gogojungle.co.jp/tools/indicators/11836
【Special Video】 First Session (Includes Special Indicator for Viewing perks)
https://www.gogojungle.co.jp/finance/navi/articles/70917
【Special Video】 Second Session
https://www.gogojungle.co.jp/finance/navi/articles/71083
【Special Video】 Third Session
https://www.gogojungle.co.jp/finance/navi/articles/71151
Gold XAUUSD 1-hour chart
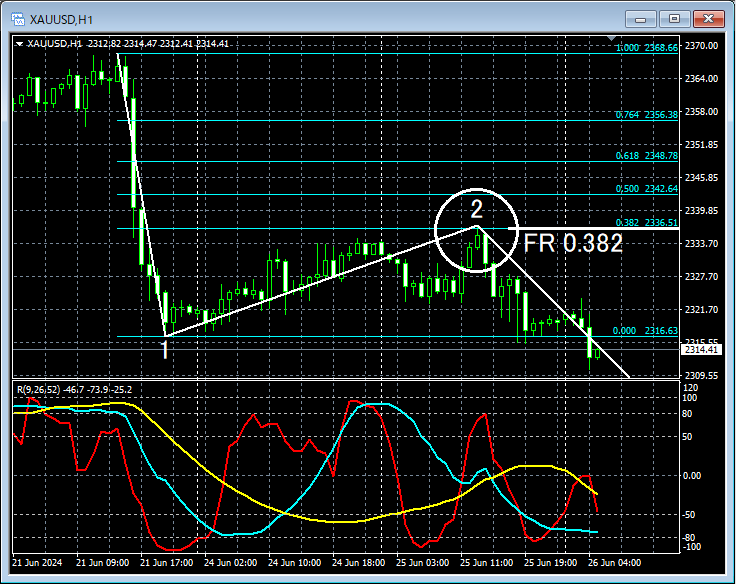
Looking at the area circled in white on the 1-hour chart above,it is assumed that this is the first down wavein response to the recent declinewhich retraced 38.2% with Fibonacci retracementfrom the recent drop.Starting of the downward third wavemay be approaching the point where a move upward is not surprising.
In such cases, “Using RCIto progressively break down to lower timeframes and ultimatelybring in the mBDSR signalto wait for the setup” is explained in detail in the included PDF. Here, we skip that process and jump straight to examining the circled area on the 1-hour chart in the 1-minute chart.
Gold XAUUSD 1-minute chart
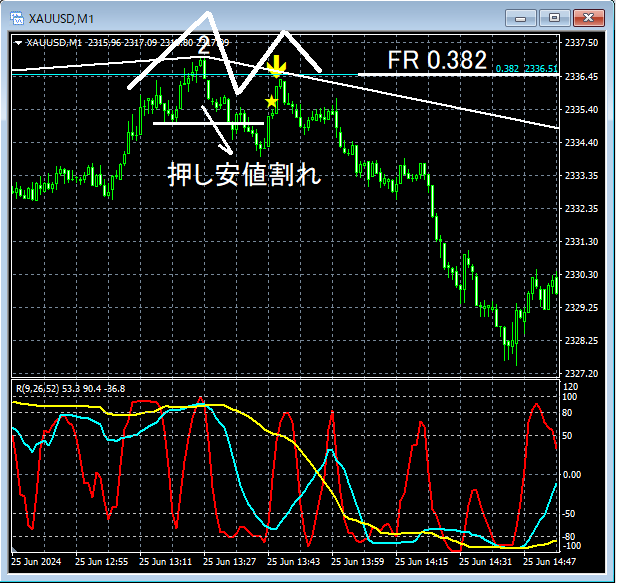
On the above 1-minute chart,a pullback low was breachedand during the subsequent risethe mBDSR sell-in-return signal (Filter: RCI26 and RCI52)lighted up, after which the price dropped sharply. As a result,the mBDSR sell-in-return signal (Filter: RCI26 and RCI52)wason the right peak of the double topafter lighting up.
From this example,a trading method focused on the start of the third waveandthe compatibility with the mBDSR signalare evident.
Also, in this example, by placing the stop slightly above the left peak of the double top, one can achieve a favorable risk-reward trade.
Indicator that is powerful in combination with RCI【BODSOR・mBDSR】
Methods and Case Studies (PDF) ★GogoJungle AWARD 2020 Winner★
https://www.gogojungle.co.jp/tools/indicators/11836
PDF files amount to 301 in total (over 1,000 pages, over 350,000 characters).
Many of them are summaries of cases where the downtrend situation on multiple lower timeframes is inferred by logically linking higher and lower timeframes using the three RCI lines, ultimately waiting for pullback buying or retracement selling timing (i.e., mBDSR signals) on the lower timeframes.
Additionally,there are many entries emphasizing catching points where multiple entry reasons overlap..
Explanation usesover 1,000 charts..

Methods and Case Studies (PDF) ★GogoJungle AWARD 2020 Winner★
https://www.gogojungle.co.jp/tools/indicators/11836
【Special Video】 First Session (Includes Special Indicator for Viewing perks)
https://www.gogojungle.co.jp/finance/navi/articles/70917
【Special Video】 Second Session
https://www.gogojungle.co.jp/finance/navi/articles/71083
【Special Video】 Third Session
https://www.gogojungle.co.jp/finance/navi/articles/71151
Gold XAUUSD 1-hour chart
Looking at the area circled in white on the 1-hour chart above,it is assumed that this is the first down wavein response to the recent declinewhich retraced 38.2% with Fibonacci retracementfrom the recent drop.Starting of the downward third wavemay be approaching the point where a move upward is not surprising.
In such cases, “Using RCIto progressively break down to lower timeframes and ultimatelybring in the mBDSR signalto wait for the setup” is explained in detail in the included PDF. Here, we skip that process and jump straight to examining the circled area on the 1-hour chart in the 1-minute chart.
Gold XAUUSD 1-minute chart
On the above 1-minute chart,a pullback low was breachedand during the subsequent risethe mBDSR sell-in-return signal (Filter: RCI26 and RCI52)lighted up, after which the price dropped sharply. As a result,the mBDSR sell-in-return signal (Filter: RCI26 and RCI52)wason the right peak of the double topafter lighting up.
From this example,a trading method focused on the start of the third waveandthe compatibility with the mBDSR signalare evident.
Also, in this example, by placing the stop slightly above the left peak of the double top, one can achieve a favorable risk-reward trade.
Indicator that is powerful in combination with RCI【BODSOR・mBDSR】
Methods and Case Studies (PDF) ★GogoJungle AWARD 2020 Winner★
https://www.gogojungle.co.jp/tools/indicators/11836
PDF files amount to 301 in total (over 1,000 pages, over 350,000 characters).
Many of them are summaries of cases where the downtrend situation on multiple lower timeframes is inferred by logically linking higher and lower timeframes using the three RCI lines, ultimately waiting for pullback buying or retracement selling timing (i.e., mBDSR signals) on the lower timeframes.
Additionally,there are many entries emphasizing catching points where multiple entry reasons overlap..
Explanation usesover 1,000 charts..
× ![]()


