

[High Risk-Reward Advantageous Trade] Reversal of support/resistance line (horizontal line) and mBDSR (RCI with 2 lines filter) backing-buy signal
Indicator that captures “tops and bottoms and reversals” when combined with RCI【mBDSR】
Methods, case studies (PDF) ★GogoJungle AWARD2020 winner★
https://www.gogojungle.co.jp/tools/indicators/11836
The above products include 301 PDFs. For a list of the PDF titles and related items, please see the article below.
Regarding the 301 attached PDF files for 【BODSOR・mBDSR】
https://www.gogojungle.co.jp/finance/navi/articles/34271
AUDNZD 4-hour chart
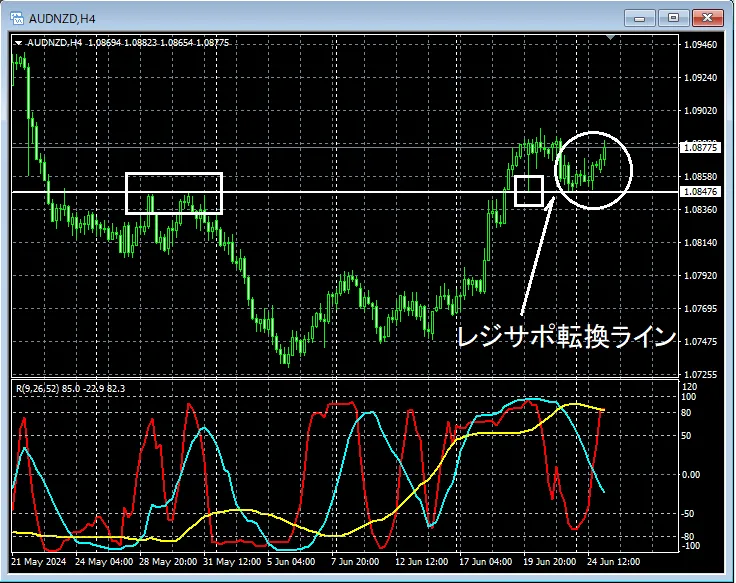
If you look at the area circled in white on the 4-hour chart abovethe horizontal lines that have been recognized as resistance and support (resistance-support reversal lines)have been pushed down near that area, so it is not unreasonable to think that there could be at least a rebound at least once.
AUDNZD 15-minute chart
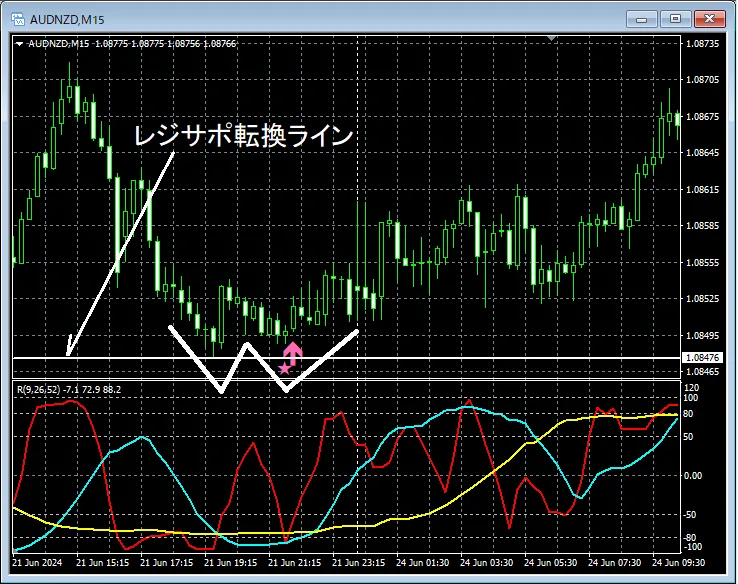
In the 15-minute chart abovethe horizontal lines that have historically been regarded as resistance or support (resistance-support reversal lines)are nearbyforming a double bottomand rising solidly. Also,the timing to start rising at the right-side valley of the double bottomis well captured bymBDSR (Filter: RCI26 and RCI52) pullback buy signalas can be seen.
From this example,the high compatibility between a trade method focusing on resistance-support reversal lines (horizontal lines) and double bottomsandthe signals of mBDSRis evident.
Also in this example, by placing the stop-loss a little below the most recent lowyou can achieve a high reward-to-risk favorable tradewith a good edge.
Indicator that shines in combination with RCI【BODSOR・mBDSR】
Methods, case studies (PDF) ★GogoJungle AWARD2020 winner★
https://www.gogojungle.co.jp/tools/indicators/11836
The PDF files include 301 items (over 1,000 pages, over 350,000 characters in total).
Many of thesesummarize examples that logically link multiple lower timeframes by using three RCI lines to create logic with the higher timeframe, eventually waiting for pullbacks in lower timeframes (i.e., mBDSR signals) for entry.
Additionally,there is a focus on capturing points where multiple entry reasons overlapas well.
In the explanations,more than 1,000 chartsare used.

Methods, case studies (PDF) ★GogoJungle AWARD2020 winner★
https://www.gogojungle.co.jp/tools/indicators/11836
The above products include 301 PDFs. For a list of the PDF titles and related items, please see the article below.
Regarding the 301 attached PDF files for 【BODSOR・mBDSR】
https://www.gogojungle.co.jp/finance/navi/articles/34271
AUDNZD 4-hour chart
If you look at the area circled in white on the 4-hour chart abovethe horizontal lines that have been recognized as resistance and support (resistance-support reversal lines)have been pushed down near that area, so it is not unreasonable to think that there could be at least a rebound at least once.
AUDNZD 15-minute chart
In the 15-minute chart abovethe horizontal lines that have historically been regarded as resistance or support (resistance-support reversal lines)are nearbyforming a double bottomand rising solidly. Also,the timing to start rising at the right-side valley of the double bottomis well captured bymBDSR (Filter: RCI26 and RCI52) pullback buy signalas can be seen.
From this example,the high compatibility between a trade method focusing on resistance-support reversal lines (horizontal lines) and double bottomsandthe signals of mBDSRis evident.
Also in this example, by placing the stop-loss a little below the most recent lowyou can achieve a high reward-to-risk favorable tradewith a good edge.
Indicator that shines in combination with RCI【BODSOR・mBDSR】
Methods, case studies (PDF) ★GogoJungle AWARD2020 winner★
https://www.gogojungle.co.jp/tools/indicators/11836
The PDF files include 301 items (over 1,000 pages, over 350,000 characters in total).
Many of thesesummarize examples that logically link multiple lower timeframes by using three RCI lines to create logic with the higher timeframe, eventually waiting for pullbacks in lower timeframes (i.e., mBDSR signals) for entry.
Additionally,there is a focus on capturing points where multiple entry reasons overlapas well.
In the explanations,more than 1,000 chartsare used.
× ![]()


