

【Targeting the double top neckline!!】From the latest USD/CAD chart
Indicator that captures “bottoms/top reversals” in combination with RCI: 【mBDSR】
Methods & Case Studies (PDF) ★GogoJungle AWARD2020 winner★
https://www.gogojungle.co.jp/tools/indicators/11836
【Special Video】 First Session (Includes special indicator for viewing benefits)
https://www.gogojungle.co.jp/finance/navi/articles/70917
【Special Video】 Second Session
https://www.gogojungle.co.jp/finance/navi/articles/71083
【Special Video】 Third Session
https://www.gogojungle.co.jp/finance/navi/articles/71151
USDCAD 30-minute chart
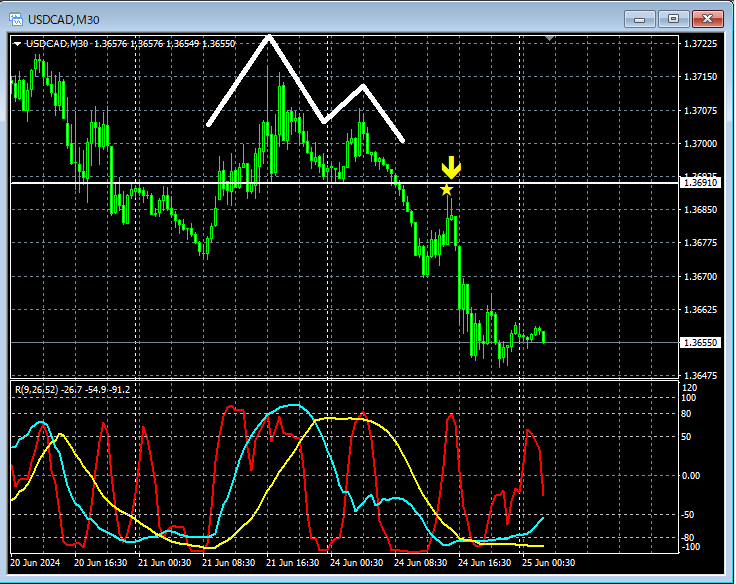
On the 30-minute chart aboveDouble Topis formed and prices are falling. From the vicinity of theneckline of the Double Topa drop started timing is coming down from theremBDSR (Filter: RCI26 and RCI52) Reversal Sell Signalaccurately captures the timing.
From this example,a trading method focusing on the Double Top and its necklineandthe signals of mBDSRshow a high degree of compatibility.
Also, in this example, by placing the stop loss slightly above the neckline of the Double Topthe trade offers a favorable risk-reward and higher edge.
Indicator that shines when combined with RCI: 【BODSOR・mBDSR】
Methods & Case Studies (PDF) ★GogoJungle AWARD2020 winner★
https://www.gogojungle.co.jp/tools/indicators/11836
A PDF file set of 301 items (over 1,000 pages, over 350,000 characters in total) is included.
Many of theseexplain how to logically link higher and lower timeframes using three RCI lines, examining the conditions of multiple lower timeframes sequentially, and ultimately waiting for buy-the-dull-pullbacks or pullback sell timings (i.e., mBDSR signals) on the lower timeframesin a consolidated form.
Additionally,a focus on identifying points where multiple entry bases coincide is common.has been emphasized in explanations.
In the explanations,more than 1,000 chartsare used.

Methods & Case Studies (PDF) ★GogoJungle AWARD2020 winner★
https://www.gogojungle.co.jp/tools/indicators/11836
【Special Video】 First Session (Includes special indicator for viewing benefits)
https://www.gogojungle.co.jp/finance/navi/articles/70917
【Special Video】 Second Session
https://www.gogojungle.co.jp/finance/navi/articles/71083
【Special Video】 Third Session
https://www.gogojungle.co.jp/finance/navi/articles/71151
USDCAD 30-minute chart
On the 30-minute chart aboveDouble Topis formed and prices are falling. From the vicinity of theneckline of the Double Topa drop started timing is coming down from theremBDSR (Filter: RCI26 and RCI52) Reversal Sell Signalaccurately captures the timing.
From this example,a trading method focusing on the Double Top and its necklineandthe signals of mBDSRshow a high degree of compatibility.
Also, in this example, by placing the stop loss slightly above the neckline of the Double Topthe trade offers a favorable risk-reward and higher edge.
Indicator that shines when combined with RCI: 【BODSOR・mBDSR】
Methods & Case Studies (PDF) ★GogoJungle AWARD2020 winner★
https://www.gogojungle.co.jp/tools/indicators/11836
A PDF file set of 301 items (over 1,000 pages, over 350,000 characters in total) is included.
Many of theseexplain how to logically link higher and lower timeframes using three RCI lines, examining the conditions of multiple lower timeframes sequentially, and ultimately waiting for buy-the-dull-pullbacks or pullback sell timings (i.e., mBDSR signals) on the lower timeframesin a consolidated form.
Additionally,a focus on identifying points where multiple entry bases coincide is common.has been emphasized in explanations.
In the explanations,more than 1,000 chartsare used.
× ![]()


