

【Targeting the right-side valley of the double bottom!!】From the latest pound-dollar chart
0
Indicator that captures “tops/bottoms and reversals” in combination with RCI: 【mBDSR】
Methods and Case Studies (PDF) ★GogoJungle AWARD2020 Winner★
https://www.gogojungle.co.jp/tools/indicators/11836
【Special Video】 First edition (Includes special indicator for viewing privilege)
https://www.gogojungle.co.jp/finance/navi/articles/70917
【Special Video】 Second edition
https://www.gogojungle.co.jp/finance/navi/articles/71083
【Special Video】 Third edition
https://www.gogojungle.co.jp/finance/navi/articles/71151
Pound/Dollar 30-minute chart
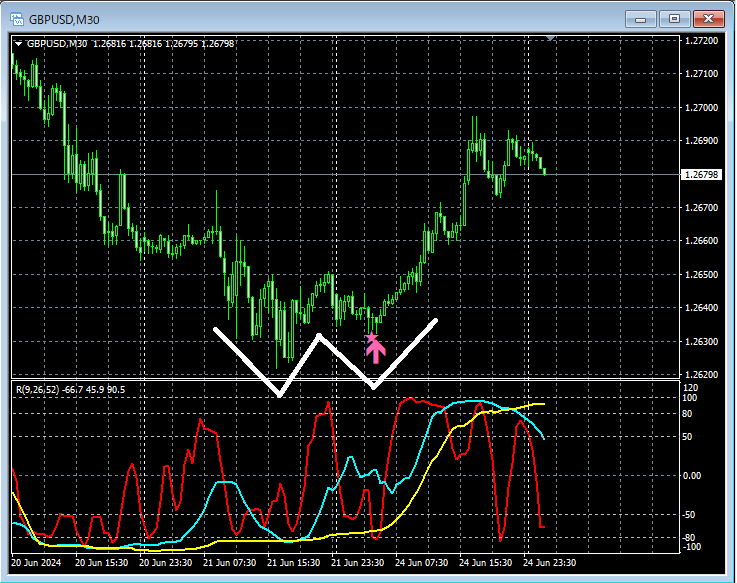
In the 30-minute chart aboveDouble Bottomhas formed and is rising sharply. TheRight-side bottom of the double bottommarks the timing to start risingmBDSR (Filter: RCI26 and RCI52) pullback buy signalcaptures this timing well.
From this example,the trading method focusing on the double bottomandthe harmony with mBDSR signalsare evidently highly compatible.
Also, in this example, by placing the stop loss slightly below the recent low,you can achieve a high-risk-reward favorable tradewith good edge.
Indicator that shines in combination with RCI: 【BODSOR・mBDSR】
Methods and Case Studies (PDF) ★GogoJungle AWARD2020 Winner★
https://www.gogojungle.co.jp/tools/indicators/11836
A PDF file with 301 documents (over 1,000 pages, over 350,000 characters in total) is included.
Most of them are summaries of examples that logically link higher and lower timeframes by using three RCI lines, examining multiple lower-timeframe conditions sequentially, and ultimately waiting for pullback buys or pullback sells on the lower timeframes (i.e., mBDSR signals).Additionally,
There are many parts that focus on this.
In the explanations,are used.

Methods and Case Studies (PDF) ★GogoJungle AWARD2020 Winner★
https://www.gogojungle.co.jp/tools/indicators/11836
【Special Video】 First edition (Includes special indicator for viewing privilege)
https://www.gogojungle.co.jp/finance/navi/articles/70917
【Special Video】 Second edition
https://www.gogojungle.co.jp/finance/navi/articles/71083
【Special Video】 Third edition
https://www.gogojungle.co.jp/finance/navi/articles/71151
Pound/Dollar 30-minute chart
In the 30-minute chart aboveDouble Bottomhas formed and is rising sharply. TheRight-side bottom of the double bottommarks the timing to start risingmBDSR (Filter: RCI26 and RCI52) pullback buy signalcaptures this timing well.
From this example,the trading method focusing on the double bottomandthe harmony with mBDSR signalsare evidently highly compatible.
Also, in this example, by placing the stop loss slightly below the recent low,you can achieve a high-risk-reward favorable tradewith good edge.
Indicator that shines in combination with RCI: 【BODSOR・mBDSR】
Methods and Case Studies (PDF) ★GogoJungle AWARD2020 Winner★
https://www.gogojungle.co.jp/tools/indicators/11836
A PDF file with 301 documents (over 1,000 pages, over 350,000 characters in total) is included.
Most of them are summaries of examples that logically link higher and lower timeframes by using three RCI lines, examining multiple lower-timeframe conditions sequentially, and ultimately waiting for pullback buys or pullback sells on the lower timeframes (i.e., mBDSR signals).Additionally,
There are many parts that focus on this.
In the explanations,are used.
× ![]()


