

【Chart Study】Horizontal line (previous low) and mBDSR (RCI double-filter) pullback buy signal
Indicator that captures bottom/top and reversal in combination with RCI【mBDSR】
Method, case studies (PDF) ★GogoJungle AWARD2020 winner★
https://www.gogojungle.co.jp/tools/indicators/11836
The above products include 301 PDFs. For a list of their PDF titles and related information, please see the article below.
About the 301 PDF files included with 【BODSOR・mBDSR】
https://www.gogojungle.co.jp/finance/navi/articles/34271
EUR/USD 4-hour chart
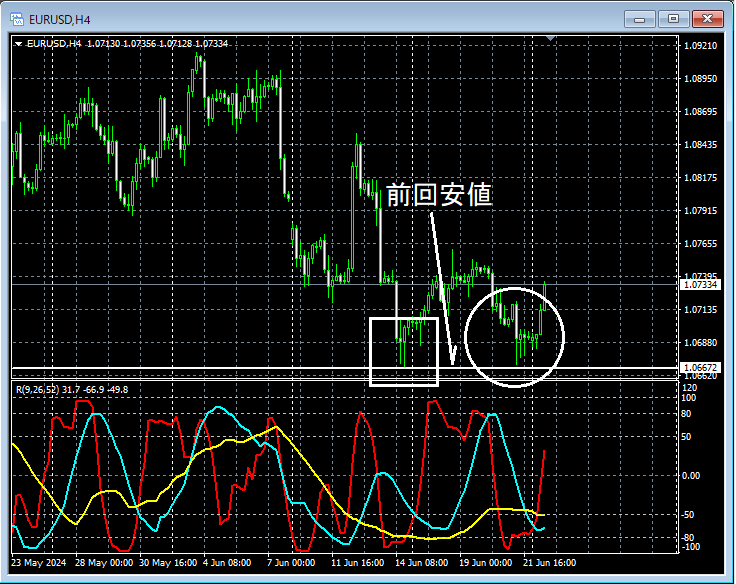
If you look at the area circled in white on the 4-hour chart above,the line indicating the previous low (horizontal line)has declined to near that level, so it’s not unreasonable to think there may be at least a rebound for now.
EUR/USD 1-hour chart
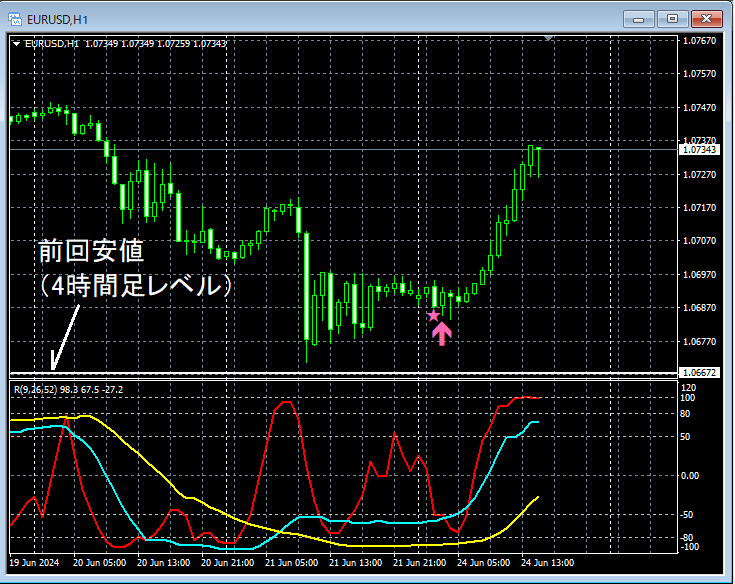
On the 1-hour chart abovethe line indicating the previous low at the 4-hour levelis nearby,mBDSR (filter: RCI26 and RCI52) pullback-buy signalhas lit up and risen sharply.
From this example,a trading method that focuses on the previous low (horizontal line)andthe signal of mBDSRshows a high degree of compatibility.
Indicator that excels in combination with RCI: 【BODSOR・mBDSR】
Method, case studies (PDF) ★GogoJungle AWARD2020 winner★
https://www.gogojungle.co.jp/tools/indicators/11836
The PDF files number 301 (over 1,000 pages, over 350,000 characters in total).
Most of them describe a method where upper and lower timeframes are logically linked using three RCI lines, allowing multiple lower timeframes to be analyzed sequentially, ultimately waiting for pullbacks/buy timings or reversals on the lower timeframes (i.e., mBDSR signals).It also focuses on points where multiple entry reasons coincide.
In the explanations,over 1,000 charts
are used.

Method, case studies (PDF) ★GogoJungle AWARD2020 winner★
https://www.gogojungle.co.jp/tools/indicators/11836
The above products include 301 PDFs. For a list of their PDF titles and related information, please see the article below.
About the 301 PDF files included with 【BODSOR・mBDSR】
https://www.gogojungle.co.jp/finance/navi/articles/34271
EUR/USD 4-hour chart
If you look at the area circled in white on the 4-hour chart above,the line indicating the previous low (horizontal line)has declined to near that level, so it’s not unreasonable to think there may be at least a rebound for now.
EUR/USD 1-hour chart
On the 1-hour chart abovethe line indicating the previous low at the 4-hour levelis nearby,mBDSR (filter: RCI26 and RCI52) pullback-buy signalhas lit up and risen sharply.
From this example,a trading method that focuses on the previous low (horizontal line)andthe signal of mBDSRshows a high degree of compatibility.
Indicator that excels in combination with RCI: 【BODSOR・mBDSR】
Method, case studies (PDF) ★GogoJungle AWARD2020 winner★
https://www.gogojungle.co.jp/tools/indicators/11836
The PDF files number 301 (over 1,000 pages, over 350,000 characters in total).
Most of them describe a method where upper and lower timeframes are logically linked using three RCI lines, allowing multiple lower timeframes to be analyzed sequentially, ultimately waiting for pullbacks/buy timings or reversals on the lower timeframes (i.e., mBDSR signals).It also focuses on points where multiple entry reasons coincide.
In the explanations,over 1,000 charts
are used.
× ![]()


