

[Chart Research] Reversal of resistance-turned-support and mBDSR (RCI2 double filter) pullback-buy signal
Indicator that captures “top-bottom and reversal” with RCI combination: 【mBDSR】
Methods and Case Study (PDF) ★GogoJungle AWARD2020 Winner★
https://www.gogojungle.co.jp/tools/indicators/11836
The above products include 301 PDF files. For the list of those PDFs’ titles and related details, please see the article below.
About the 301 PDF files included with 【BODSOR・mBDSR】
https://www.gogojungle.co.jp/finance/navi/articles/34271
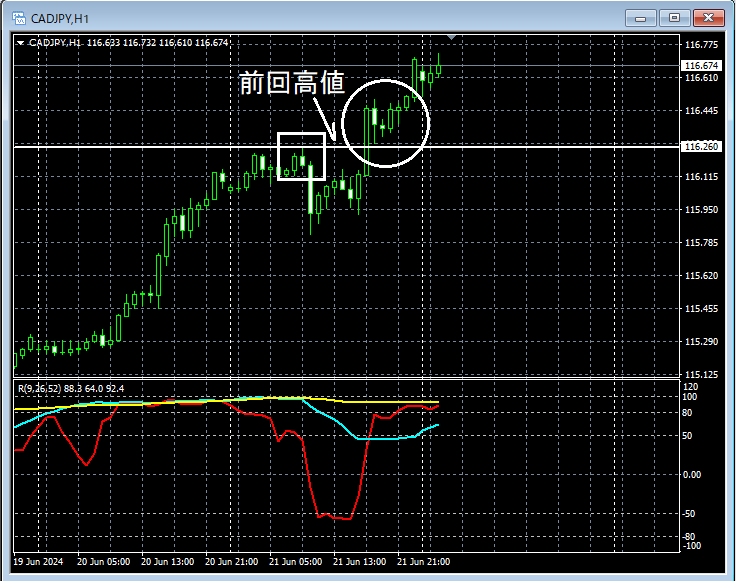
USD/JPY 1-hour chart
USD/JPY 15-minute chart
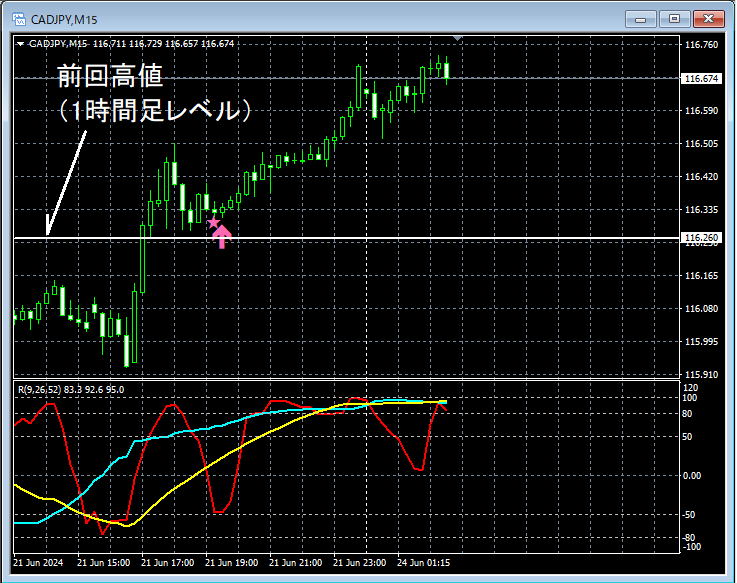
If you look at the 15-minute chart around the area circled in white on the 1-hour chart,the line indicating the previous highwas broken to the upside, and as it dropped toward around that line,mBDSR (Filter: RCI26 and RCI52) pullback buy signallighting up, and subsequently the price rose steadily.
From this example,the compatibility between trading methods that focus on previous highs and resistance/support turnsandthe pullback buy signal of mBDSRappears evident.
Indicator that exhibits power when combined with RCI: 【BODSOR・mBDSR】
Methods and Case Study (PDF) ★GogoJungle AWARD2020 Winner★
https://www.gogojungle.co.jp/tools/indicators/11836
The PDF files number 301 (over 1,000 pages in total, over 350,000 characters).
Many of these are aboutthoroughly linking multiple higher and lower timeframes logically using three RCI lines, then examining the conditions of multiple lower timeframes in sequence, and finally waiting for pullbacks buy or retracements sell signals on the lower timeframe (i.e., mBDSR signals)in a compiled form.
Additionally,many focus on identifying points where multiple entry reasons overlapas a priority.
In the explanations,more than 1,000 chartsare used.

Methods and Case Study (PDF) ★GogoJungle AWARD2020 Winner★
https://www.gogojungle.co.jp/tools/indicators/11836
The above products include 301 PDF files. For the list of those PDFs’ titles and related details, please see the article below.
About the 301 PDF files included with 【BODSOR・mBDSR】
https://www.gogojungle.co.jp/finance/navi/articles/34271
USD/JPY 1-hour chart
USD/JPY 15-minute chart
If you look at the 15-minute chart around the area circled in white on the 1-hour chart,the line indicating the previous highwas broken to the upside, and as it dropped toward around that line,mBDSR (Filter: RCI26 and RCI52) pullback buy signallighting up, and subsequently the price rose steadily.
From this example,the compatibility between trading methods that focus on previous highs and resistance/support turnsandthe pullback buy signal of mBDSRappears evident.
Indicator that exhibits power when combined with RCI: 【BODSOR・mBDSR】
Methods and Case Study (PDF) ★GogoJungle AWARD2020 Winner★
https://www.gogojungle.co.jp/tools/indicators/11836
The PDF files number 301 (over 1,000 pages in total, over 350,000 characters).
Many of these are aboutthoroughly linking multiple higher and lower timeframes logically using three RCI lines, then examining the conditions of multiple lower timeframes in sequence, and finally waiting for pullbacks buy or retracements sell signals on the lower timeframe (i.e., mBDSR signals)in a compiled form.
Additionally,many focus on identifying points where multiple entry reasons overlapas a priority.
In the explanations,more than 1,000 chartsare used.
× ![]()


