

[Chart Study] Three-Bar Reversal Pattern, Countertrend Line, and mBDSR (RCI two-line filter) Buy Signal on Pullback
Indicator 【mBDSR】 that captures “tops/bottoms and reversals” in combination with RCI
Methods and Case Studies (PDF) ★GogoJungle AWARD2020 winner★
https://www.gogojungle.co.jp/tools/indicators/11836
The above products include 301 PDFs. For a list of their PDF titles, please see the article below.
About the 301 PDF files included with 【BODSOR・mBDSR】
https://www.gogojungle.co.jp/finance/navi/articles/34271
EUR/GBP 15-minute chart
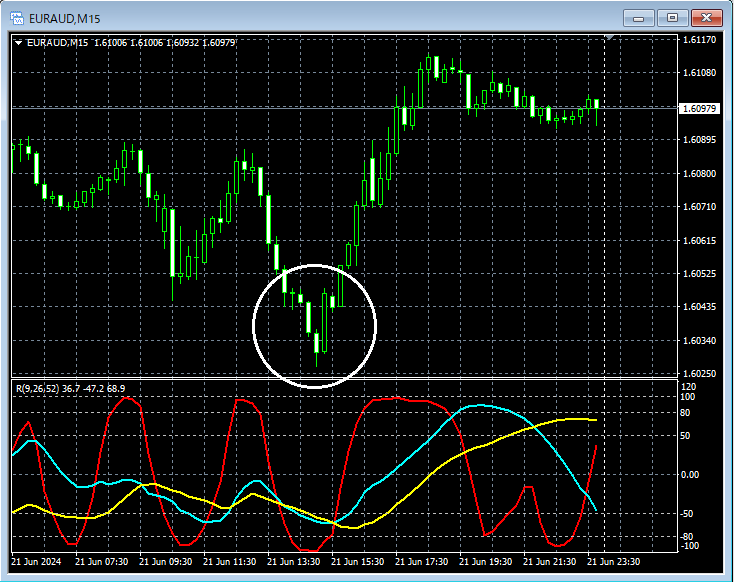
Looking at the area circled by the white circle on the 15-minute chart above, it suggests an upward moveThree-bar reversal patternappears. It might not be unusual to consider buying on dips on a lower time frame.
EUR/GBP 1-minute chart
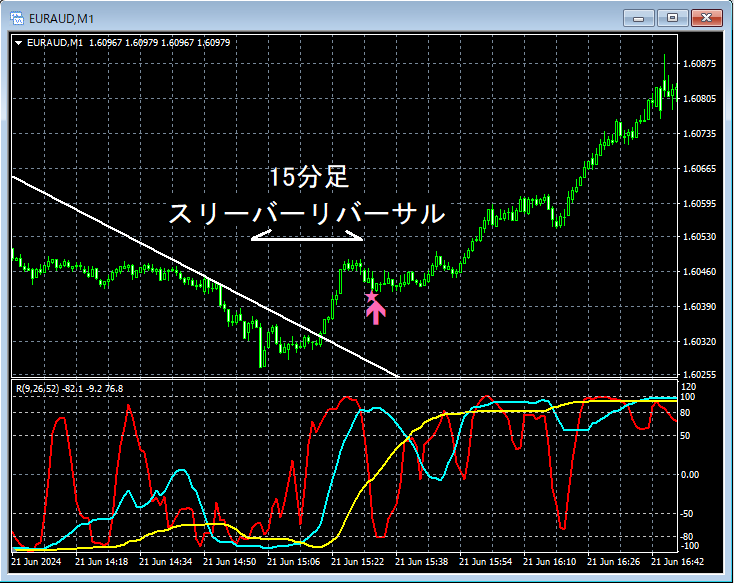
On the 1-minute chart aboveCounter-trend lineis broken upward, and on the 15-minute chartThree-bar reversal patternappears, followed by a decline in whichmBDSR (Filter: RCI26 and RCI52) buy-the-dip signallights up and moves higher.
From this example,the Three-bar reversal pattern and counter-trend line trading methodandthe signals of mBDSRshow strong compatibility.
Indicator 【BODSOR・mBDSR】 that shines in combination with RCI
Methods and Case Studies (PDF) ★GogoJungle AWARD2020 winner★
https://www.gogojungle.co.jp/tools/indicators/11836
PDF files total 301 (over 1,000 pages, over 350,000 characters).
Many of them arecompiled as examples showing how logically linking the upper and lower timeframes using the RCI 3-line method can sequentially analyze multiple lower-timeframe conditions, ultimately waiting for a pullback buy or a bounce sell timing (i.e., mBDSR signals) on the lower timeframes..
In addition,many of them focus on identifying points where multiple entry signals overlap.
The explanation usesmore than 1,000 charts.

Methods and Case Studies (PDF) ★GogoJungle AWARD2020 winner★
https://www.gogojungle.co.jp/tools/indicators/11836
The above products include 301 PDFs. For a list of their PDF titles, please see the article below.
About the 301 PDF files included with 【BODSOR・mBDSR】
https://www.gogojungle.co.jp/finance/navi/articles/34271
EUR/GBP 15-minute chart
Looking at the area circled by the white circle on the 15-minute chart above, it suggests an upward moveThree-bar reversal patternappears. It might not be unusual to consider buying on dips on a lower time frame.
EUR/GBP 1-minute chart
On the 1-minute chart aboveCounter-trend lineis broken upward, and on the 15-minute chartThree-bar reversal patternappears, followed by a decline in whichmBDSR (Filter: RCI26 and RCI52) buy-the-dip signallights up and moves higher.
From this example,the Three-bar reversal pattern and counter-trend line trading methodandthe signals of mBDSRshow strong compatibility.
Indicator 【BODSOR・mBDSR】 that shines in combination with RCI
Methods and Case Studies (PDF) ★GogoJungle AWARD2020 winner★
https://www.gogojungle.co.jp/tools/indicators/11836
PDF files total 301 (over 1,000 pages, over 350,000 characters).
Many of them arecompiled as examples showing how logically linking the upper and lower timeframes using the RCI 3-line method can sequentially analyze multiple lower-timeframe conditions, ultimately waiting for a pullback buy or a bounce sell timing (i.e., mBDSR signals) on the lower timeframes..
In addition,many of them focus on identifying points where multiple entry signals overlap.
The explanation usesmore than 1,000 charts.
× ![]()


