

[Chart Research] Signals suggesting a reversal downturn on higher timeframes and the return-sell signals of mBDSR (RCI two-filter)
Indicator that captures “tops/bottoms and reversals” in combination with RCI【mBDSR】
Methods and Case Studies (PDF) ★GogoJungle AWARD2020 recipient★
https://www.gogojungle.co.jp/tools/indicators/11836
The above product includes 301 PDFs. For a list of the PDFs’ titles and related information, please see the article below.
About the 301 PDF files included with 【BODSOR・mBDSR】
https://www.gogojungle.co.jp/finance/navi/articles/34271
GBP/AUD 1-hour chart
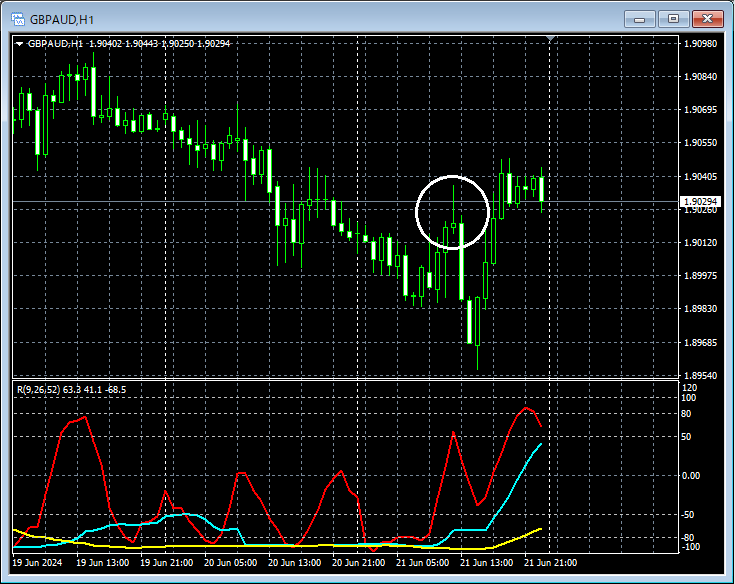
Looking at the area circled in white on the 1-hour chart above, a signal suggesting a decline is presentPin Bar (long upper shadow)appears.
GBP/AUD 30-minute chart
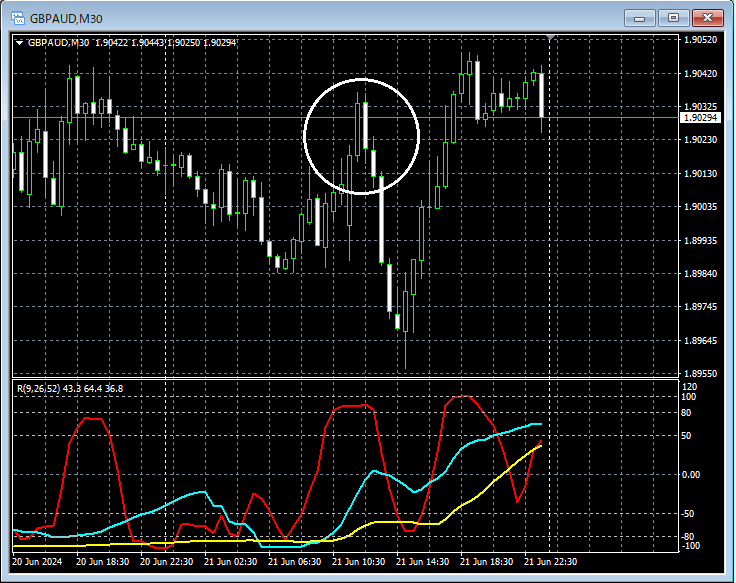
On the 30-minute chart above (on the 1-hour chartPin Barappears), and the circled area indicates a declineTwo Bar Reversalis present.
GBP/AUD 15-minute chart
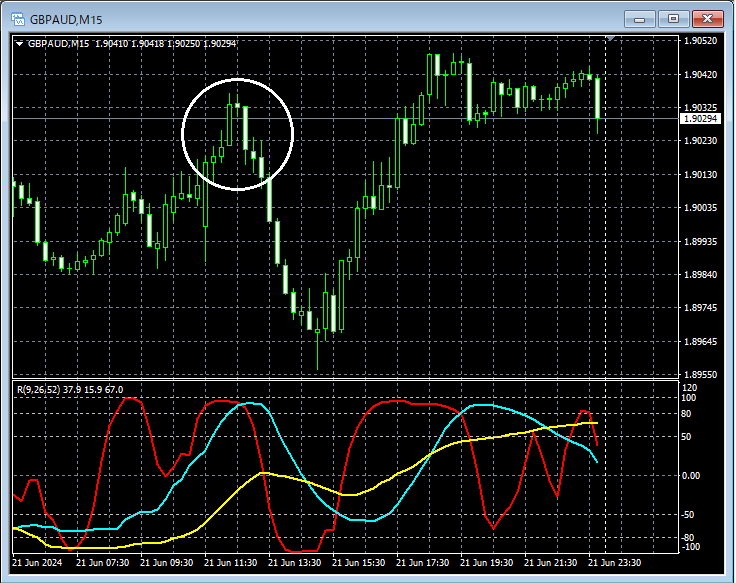
On the 15-minute chart above (on the 1-hour chartPin Bar, on the 30-minute chartTwo Bar Reversalis present), and the circled area indicates a declineEvening Star of Sakata Gohoucandle pattern appears.
GBP/AUD 1-minute chart
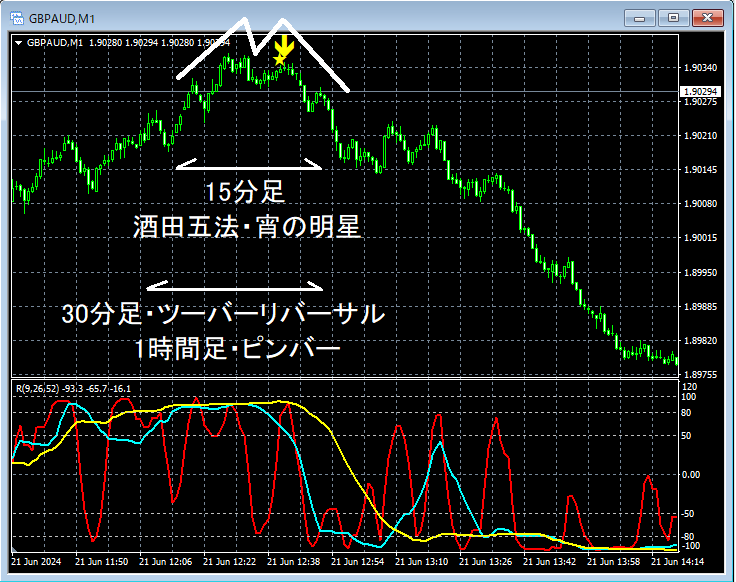
On the 1-minute chart above (on the 1-hour chartPin Bar, on the 30-minute chartTwo Bar Reversal, on the 15-minute chartEvening Star of Sakata Gohoucandle pattern appears around the circled area) aDouble Topis formed and the price plunges. Here,the right peak of the double topshowsthe mBDSR (RCI two-lines filter) shorting signallighting up.
In this example, before the candlestick pattern indicating a downtrend on the higher time frame,the mBDSR (RCI two-lines filter) shorting signalcaptures the timing of the start of the decline effectively.
Indicator that shines in combination with RCI【BODSOR・mBDSR】
Methods and Case Studies (PDF) ★GogoJungle AWARD2020 recipient★
https://www.gogojungle.co.jp/tools/indicators/11836
The PDF files include 301 items (over 1,000 pages, over 350,000 characters in total).
Many of them are designed to logically link higher and lower time frames using three RCI lines, progressively examining multiple lower-time-frame conditions and ultimately waiting for timing signals (the mBDSR signals) to buy on dips or sell on rallies on the lower time frame.
Additionally,there are many resources that focus on identifying points where multiple entry reasons align..
The explanations useover 1,000 charts..

Methods and Case Studies (PDF) ★GogoJungle AWARD2020 recipient★
https://www.gogojungle.co.jp/tools/indicators/11836
The above product includes 301 PDFs. For a list of the PDFs’ titles and related information, please see the article below.
About the 301 PDF files included with 【BODSOR・mBDSR】
https://www.gogojungle.co.jp/finance/navi/articles/34271
GBP/AUD 1-hour chart
Looking at the area circled in white on the 1-hour chart above, a signal suggesting a decline is presentPin Bar (long upper shadow)appears.
GBP/AUD 30-minute chart
On the 30-minute chart above (on the 1-hour chartPin Barappears), and the circled area indicates a declineTwo Bar Reversalis present.
GBP/AUD 15-minute chart
On the 15-minute chart above (on the 1-hour chartPin Bar, on the 30-minute chartTwo Bar Reversalis present), and the circled area indicates a declineEvening Star of Sakata Gohoucandle pattern appears.
GBP/AUD 1-minute chart
On the 1-minute chart above (on the 1-hour chartPin Bar, on the 30-minute chartTwo Bar Reversal, on the 15-minute chartEvening Star of Sakata Gohoucandle pattern appears around the circled area) aDouble Topis formed and the price plunges. Here,the right peak of the double topshowsthe mBDSR (RCI two-lines filter) shorting signallighting up.
In this example, before the candlestick pattern indicating a downtrend on the higher time frame,the mBDSR (RCI two-lines filter) shorting signalcaptures the timing of the start of the decline effectively.
Indicator that shines in combination with RCI【BODSOR・mBDSR】
Methods and Case Studies (PDF) ★GogoJungle AWARD2020 recipient★
https://www.gogojungle.co.jp/tools/indicators/11836
The PDF files include 301 items (over 1,000 pages, over 350,000 characters in total).
Many of them are designed to logically link higher and lower time frames using three RCI lines, progressively examining multiple lower-time-frame conditions and ultimately waiting for timing signals (the mBDSR signals) to buy on dips or sell on rallies on the lower time frame.
Additionally,there are many resources that focus on identifying points where multiple entry reasons align..
The explanations useover 1,000 charts..
× ![]()


