

【Risk-reward favorable and high edge trade!!】Pound-Australian dollar 1-minute chart from yesterday
0
Indicator “Capture Tops and Bottoms/Reversals” in combination with RCI – mBDSR
Methods and Case Studies (PDF) ★GogoJungle AWARD2020 Winner★
https://www.gogojungle.co.jp/tools/indicators/11836
【Special Video】First Time (Includes “Viewing Bonus Special Indicator”)
https://www.gogojungle.co.jp/finance/navi/articles/70917
【Special Video】Second Time
https://www.gogojungle.co.jp/finance/navi/articles/71083
【Special Video】Third Time
https://www.gogojungle.co.jp/finance/navi/articles/71151
GBP/AUD – 1-minute chart
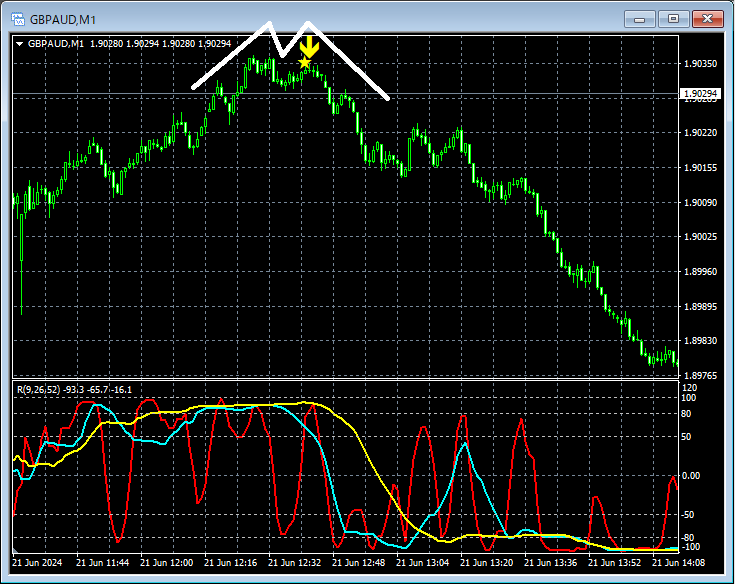
Like the 1-hour chart above,the right peak of the double topisthe mBDSR (filters: RCI26 and RCI52) sell-back signalthat lights up; by placing the stop lossslightly above the left peak of the double top, one can achievea high-risk-reward advantageous tradeopportunity.
Indicator that shines in combination with RCI – 【BODSOR/mBDSR】
Methods and Case Studies (PDF) ★GogoJungle AWARD2020 Winner★
https://www.gogojungle.co.jp/tools/indicators/11836
The PDF file includes 301 documents (over 1,000 pages, over 350,000 characters).
Many of themdocument how to logically link higher and lower timeframes using three RCI lines, sequentially examining multiple lower timeframes, and ultimately waiting for pullback or retracement timing on the lower timeframe (i.e., the mBDSR signal).This is summarized.
Additionally,many emphasize identifying points where multiple entry justifications overlap.There is a focus on those.
In the explanations,over 1,000 chartsare used.

Methods and Case Studies (PDF) ★GogoJungle AWARD2020 Winner★
https://www.gogojungle.co.jp/tools/indicators/11836
【Special Video】First Time (Includes “Viewing Bonus Special Indicator”)
https://www.gogojungle.co.jp/finance/navi/articles/70917
【Special Video】Second Time
https://www.gogojungle.co.jp/finance/navi/articles/71083
【Special Video】Third Time
https://www.gogojungle.co.jp/finance/navi/articles/71151
GBP/AUD – 1-minute chart
Like the 1-hour chart above,the right peak of the double topisthe mBDSR (filters: RCI26 and RCI52) sell-back signalthat lights up; by placing the stop lossslightly above the left peak of the double top, one can achievea high-risk-reward advantageous tradeopportunity.
Indicator that shines in combination with RCI – 【BODSOR/mBDSR】
Methods and Case Studies (PDF) ★GogoJungle AWARD2020 Winner★
https://www.gogojungle.co.jp/tools/indicators/11836
The PDF file includes 301 documents (over 1,000 pages, over 350,000 characters).
Many of themdocument how to logically link higher and lower timeframes using three RCI lines, sequentially examining multiple lower timeframes, and ultimately waiting for pullback or retracement timing on the lower timeframe (i.e., the mBDSR signal).This is summarized.
Additionally,many emphasize identifying points where multiple entry justifications overlap.There is a focus on those.
In the explanations,over 1,000 chartsare used.
× ![]()


