

[Capture the Bottom and Reversal!!] Hanging man at the high in USD/JPY and the return-sell signal with mBDSR (RCI two-filter) in the return move
0
Indicator “Capture Tops and Bottoms and Reversals” in combination with RCI【mBDSR】
Methods and Case Studies (PDF) ★GogoJungle AWARD2020 Winner★
https://www.gogojungle.co.jp/tools/indicators/11836
【Special Video】 First Edition (Includes Viewing Privilege Special Indicator)
https://www.gogojungle.co.jp/finance/navi/articles/70917
【Special Video】 Second Edition
https://www.gogojungle.co.jp/finance/navi/articles/71083
【Special Video】 Third Edition
https://www.gogojungle.co.jp/finance/navi/articles/71151
USD/JPY 4-hour chart
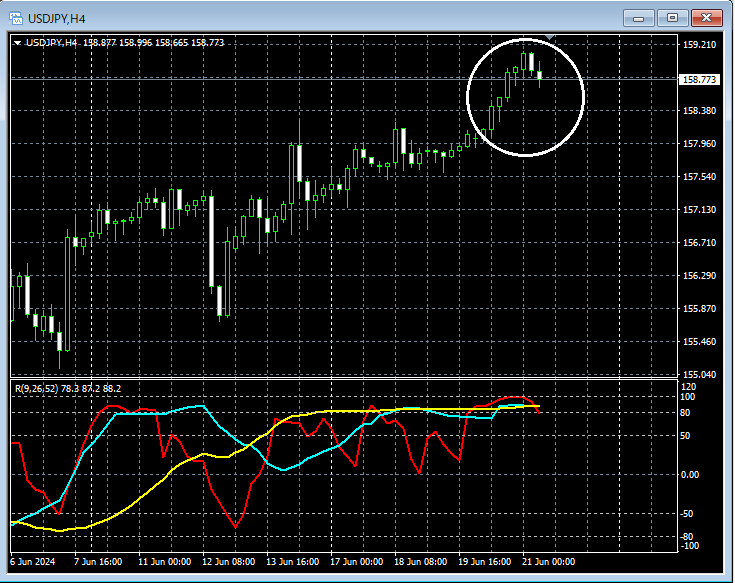
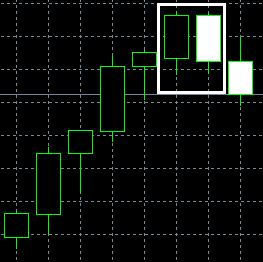
Looking at the area circled in white on the 4-hour chart aboveEngulfingappears. This candlestick pattern suggests a bearish reversal, and it may not be unusual to consider selling on rallies on lower timeframes.
USD/JPY 30-minute chart
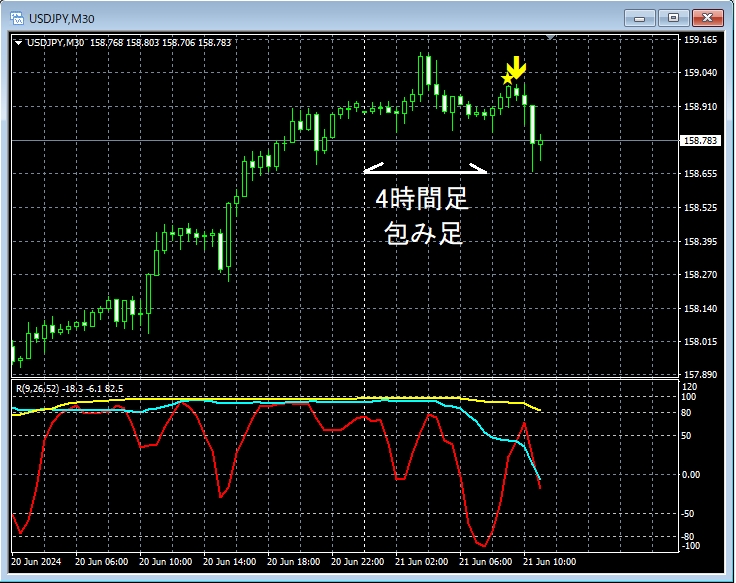
After the 4-hour engulfingEngulfingappears, on the upper 30-minute chartmBDSR (Filter: RCI26 and RCI52) Sell signallights up and price moves downward.
From this example,A trading method focusing on engulfing patternsandthe signals of mBDSRseem to be highly complementary.
Indicator “BODSOR/mBDSR” that powers in combination with RCI
Methods and Case Studies (PDF) ★GogoJungle AWARD2020 Winner★
https://www.gogojungle.co.jp/tools/indicators/11836
The PDF file includes 301 files (over 1,000 pages, over 350,000 characters in total).
Many of theseexplain how to logically link higher and lower timeframes using the three RCI lines, systematically analyze multiple lower-timeframe conditions, and ultimately wait for the timing to buy on dips or sell on rallies (i.e., the mBDSR signals) on the lower timeframes.These are compiled into examples.
Additionally,many focus on identifying points where multiple entry reasons overlap.There are many more such cases.
In the explanations,more than 1,000 chartsare used.

Methods and Case Studies (PDF) ★GogoJungle AWARD2020 Winner★
https://www.gogojungle.co.jp/tools/indicators/11836
【Special Video】 First Edition (Includes Viewing Privilege Special Indicator)
https://www.gogojungle.co.jp/finance/navi/articles/70917
【Special Video】 Second Edition
https://www.gogojungle.co.jp/finance/navi/articles/71083
【Special Video】 Third Edition
https://www.gogojungle.co.jp/finance/navi/articles/71151
USD/JPY 4-hour chart
Looking at the area circled in white on the 4-hour chart aboveEngulfingappears. This candlestick pattern suggests a bearish reversal, and it may not be unusual to consider selling on rallies on lower timeframes.
USD/JPY 30-minute chart
After the 4-hour engulfingEngulfingappears, on the upper 30-minute chartmBDSR (Filter: RCI26 and RCI52) Sell signallights up and price moves downward.
From this example,A trading method focusing on engulfing patternsandthe signals of mBDSRseem to be highly complementary.
Indicator “BODSOR/mBDSR” that powers in combination with RCI
Methods and Case Studies (PDF) ★GogoJungle AWARD2020 Winner★
https://www.gogojungle.co.jp/tools/indicators/11836
The PDF file includes 301 files (over 1,000 pages, over 350,000 characters in total).
Many of theseexplain how to logically link higher and lower timeframes using the three RCI lines, systematically analyze multiple lower-timeframe conditions, and ultimately wait for the timing to buy on dips or sell on rallies (i.e., the mBDSR signals) on the lower timeframes.These are compiled into examples.
Additionally,many focus on identifying points where multiple entry reasons overlap.There are many more such cases.
In the explanations,more than 1,000 chartsare used.
× ![]()


