

[Chart Research] 2B Reversal and mBDSR (RCI2-band filter) Buy Signal
Indicator that captures "bottoms/top reversals" in combination with RCI: 【mBDSR】
Method and Case Studies (PDF) ★GogoJungle AWARD2020 Winner★
https://www.gogojungle.co.jp/tools/indicators/11836
The above products include 301 PDFs. For a list of the titles of those PDFs, please see the article below.
About the 301 PDF files included with 【BODSOR・mBDSR】
https://www.gogojungle.co.jp/finance/navi/articles/34271
CADJPY 1-hour chart
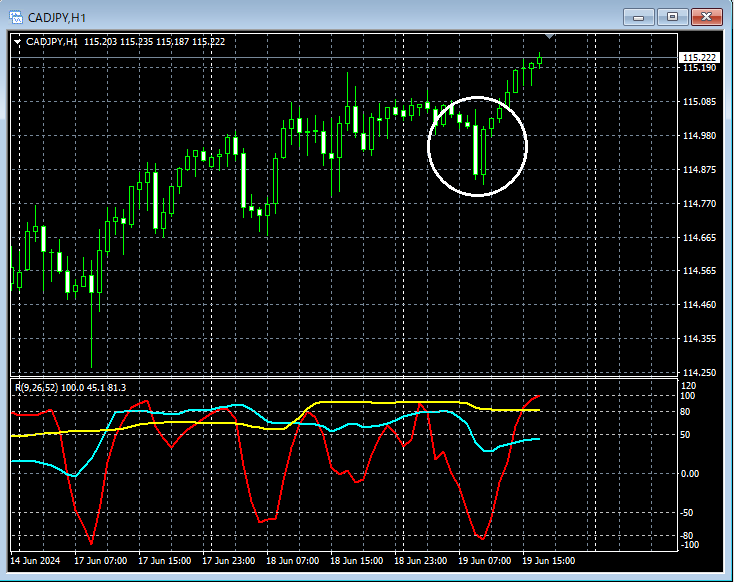
If you look at the area surrounded by white on the 1-hour chart above, it suggests a rising trend2B Reversalappears, and it may not be strange to consider a pullback-buy on the lower time frame.
CADJPY 5-minute chart
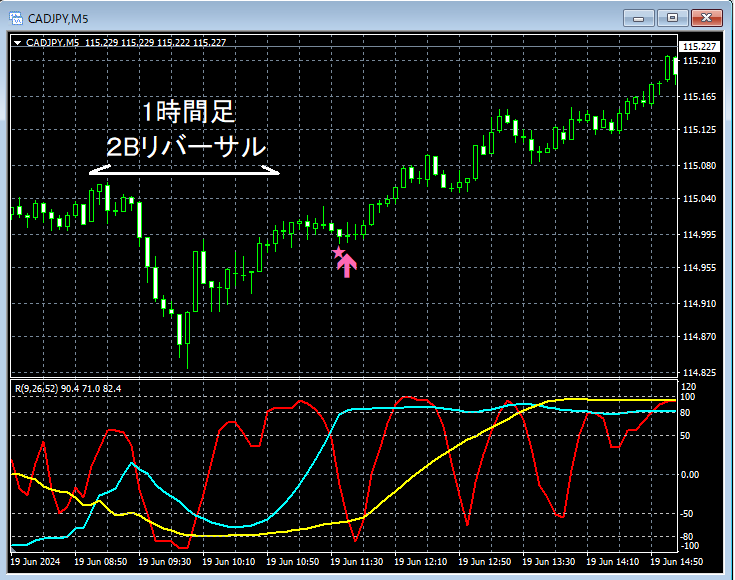
On the 5-minute chart above, on the 1-hour chart2B Reversalappears,mBDSR (Filter: RCI26 and RCI52) pullback-buy signallights up and continues to rise.
From this example,the Trade method focused on 2B Reversalandthe compatibility with mBDSR signalssuggest a high degree of synergy.
Indicator that shines in combination with RCI: 【BODSOR・mBDSR】
Method and Case Studies (PDF) ★GogoJungle AWARD2020 Winner★
https://www.gogojungle.co.jp/tools/indicators/11836
The package includes 301 PDF files (over 1,000 pages, over 350,000 characters in total).
Many of them are about how to logically link higher and lower timeframes using the RCI three-line setup, examining the status of multiple lower timeframes sequentially, and ultimately waiting for pullback-buy or pullback-sell timing on the lower timeframes (i.e., mBDSR signals).a focus on identifying multiple entry reasons converging at a pointIt also covers
as well.
In the explanations,more than 1,000 chartsare used.

Method and Case Studies (PDF) ★GogoJungle AWARD2020 Winner★
https://www.gogojungle.co.jp/tools/indicators/11836
The above products include 301 PDFs. For a list of the titles of those PDFs, please see the article below.
About the 301 PDF files included with 【BODSOR・mBDSR】
https://www.gogojungle.co.jp/finance/navi/articles/34271
CADJPY 1-hour chart
If you look at the area surrounded by white on the 1-hour chart above, it suggests a rising trend2B Reversalappears, and it may not be strange to consider a pullback-buy on the lower time frame.
CADJPY 5-minute chart
On the 5-minute chart above, on the 1-hour chart2B Reversalappears,mBDSR (Filter: RCI26 and RCI52) pullback-buy signallights up and continues to rise.
From this example,the Trade method focused on 2B Reversalandthe compatibility with mBDSR signalssuggest a high degree of synergy.
Indicator that shines in combination with RCI: 【BODSOR・mBDSR】
Method and Case Studies (PDF) ★GogoJungle AWARD2020 Winner★
https://www.gogojungle.co.jp/tools/indicators/11836
The package includes 301 PDF files (over 1,000 pages, over 350,000 characters in total).
Many of them are about how to logically link higher and lower timeframes using the RCI three-line setup, examining the status of multiple lower timeframes sequentially, and ultimately waiting for pullback-buy or pullback-sell timing on the lower timeframes (i.e., mBDSR signals).a focus on identifying multiple entry reasons converging at a pointIt also covers
as well.
In the explanations,more than 1,000 chartsare used.
× ![]()


