

[Capture the Bottom and the Reversal!!] From recent EUR/CHF chart, the notable low on the higher timeframe and the return-sell signal of mBDSR (RCI 2-line filter) June 19, 2024 (Wednesday)
Indicator 【mBDSR】 that captures “tops/bottoms and reversals” in combination with RCI
Methods, case studies (PDF) ★GogoJungle AWARD2020 winner★
https://www.gogojungle.co.jp/tools/indicators/11836
【Special Video】First edition (includes【Viewing perks special indicator】)
https://www.gogojungle.co.jp/finance/navi/articles/70917
【Special Video】Second edition
https://www.gogojungle.co.jp/finance/navi/articles/71083
【Special Video】Third edition
https://www.gogojungle.co.jp/finance/navi/articles/71151
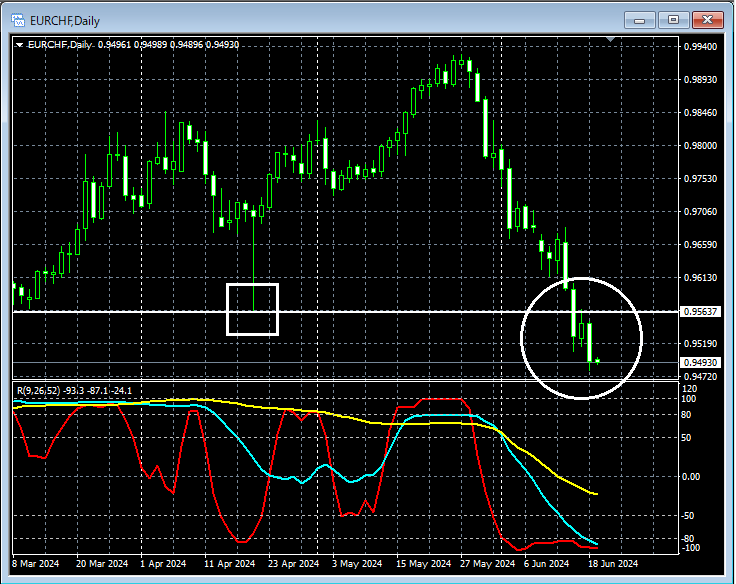
EUR/CHF Daily
EUR/CHF 4-hour
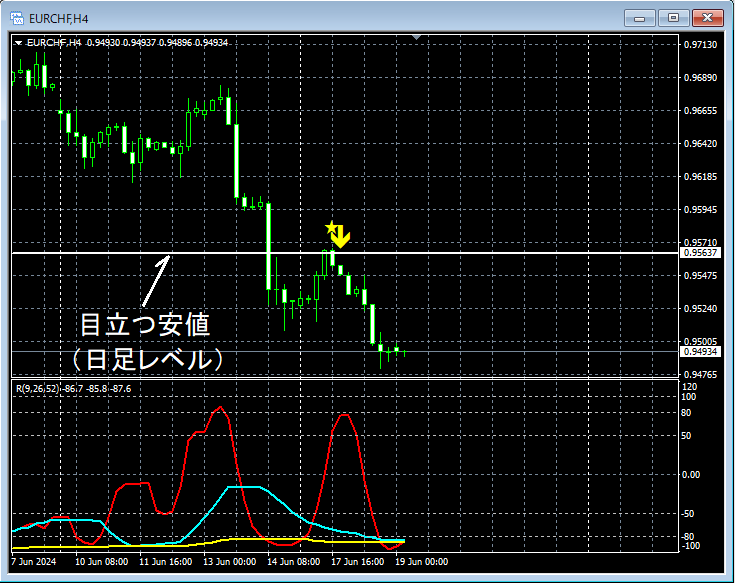
If you look at roughly the area circled in white on the daily chart in the 4-hour chart,a line indicating a notable low on the daily chartwas broken, and as it rose toward near that line,the return-sell signal of mBDSR (filters: RCI26 and RCI52) illuminatedand prices have been declining smoothly thereafter.
From this example,there is a strong harmony between a trading approach focused on notable lowsandthe return-sell signal of mBDSRthat can be observed.
Indicator 【BODSOR・mBDSR】 that is powerful in combination with RCI
Methods, case studies (PDF) ★GogoJungle AWARD2020 winner★
https://www.gogojungle.co.jp/tools/indicators/11836
A PDF file containing 301 items (over 1,000 pages, over 350,000 characters in total).
Many of these areexamples that break down the process from linking higher and lower timeframes logically using three RCI lines to sequentially examine the conditions of multiple lower timeframes, finally waiting for buying on dip or selling on rally timing (i.e., mBDSR signals) on the lower timeframe.
Additionally,many focus on capturing points where multiple entry reasons overlap.
In the explanations,more than 1,000 chartsare used.

Methods, case studies (PDF) ★GogoJungle AWARD2020 winner★
https://www.gogojungle.co.jp/tools/indicators/11836
【Special Video】First edition (includes【Viewing perks special indicator】)
https://www.gogojungle.co.jp/finance/navi/articles/70917
【Special Video】Second edition
https://www.gogojungle.co.jp/finance/navi/articles/71083
【Special Video】Third edition
https://www.gogojungle.co.jp/finance/navi/articles/71151
EUR/CHF Daily
EUR/CHF 4-hour
If you look at roughly the area circled in white on the daily chart in the 4-hour chart,a line indicating a notable low on the daily chartwas broken, and as it rose toward near that line,the return-sell signal of mBDSR (filters: RCI26 and RCI52) illuminatedand prices have been declining smoothly thereafter.
From this example,there is a strong harmony between a trading approach focused on notable lowsandthe return-sell signal of mBDSRthat can be observed.
Indicator 【BODSOR・mBDSR】 that is powerful in combination with RCI
Methods, case studies (PDF) ★GogoJungle AWARD2020 winner★
https://www.gogojungle.co.jp/tools/indicators/11836
A PDF file containing 301 items (over 1,000 pages, over 350,000 characters in total).
Many of these areexamples that break down the process from linking higher and lower timeframes logically using three RCI lines to sequentially examine the conditions of multiple lower timeframes, finally waiting for buying on dip or selling on rally timing (i.e., mBDSR signals) on the lower timeframe.
Additionally,many focus on capturing points where multiple entry reasons overlap.
In the explanations,more than 1,000 chartsare used.
× ![]()


