

[Catch the Bottom and Reversal!!] Sign of Support/Resistance Break and mBDSR (RCI 2-Filter)
0
Indicator that captures “top and bottom reversal” in combination with RCI: 【mBDSR】
Methods and Case Studies (PDF) ★GogoJungle AWARD2020 Winner★
https://www.gogojungle.co.jp/tools/indicators/11836
The above products include 301 PDF files. For a list of their PDF titles and related details, please refer to the article below.
About the 301 PDF files included with 【BODSOR・mBDSR】
https://www.gogojungle.co.jp/finance/navi/articles/34271
EURCAD 1-hour
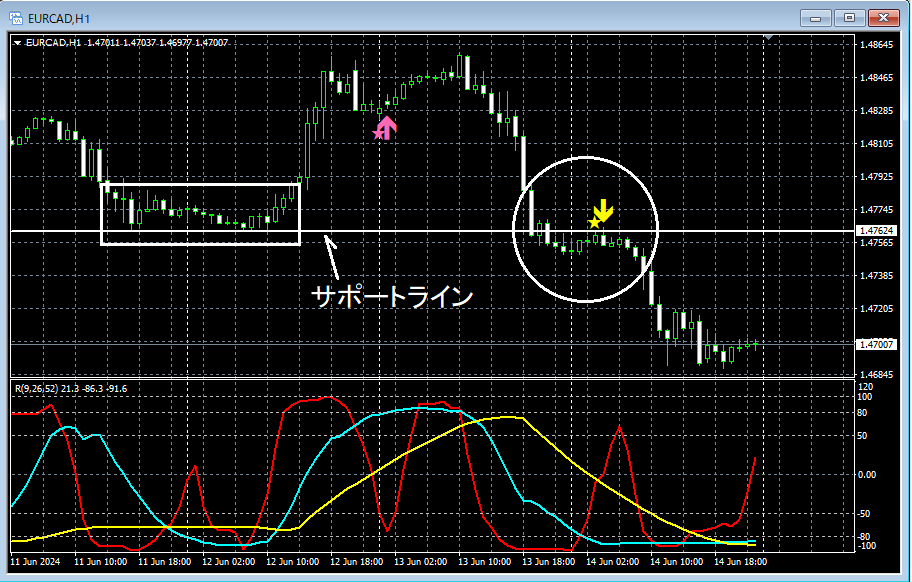
In the 1-hour chart above,Support line(horizontal line) was temporarily broken below, then rose toward near this horizontal linemBDSR (filters: RCI26 and RCI52)sell signals appeared on the rebound, and afterward, the price steadily declined.
From this example,the trade method focusing on support-resistance turning pointsand theaffinity with mBDSR signalscan be seen clearly.
Indicator that shines in combination with RCI: 【BODSOR・mBDSR】
Methods and Case Studies (PDF) ★GogoJungle AWARD2020 Winner★
https://www.gogojungle.co.jp/tools/indicators/11836
The PDF file includes 301 documents (over 1,000 pages, over 350,000 characters in total).
Many of them are designed to logically link higher and lower timeframes using three RCI lines, then progressively examine the conditions across multiple lower timeframes, ultimately waiting for swing-buy or pullback sell timing (i.e., mBDSR signals) on the lower timeframesand summarizing such examples.
Also,there are many that emphasize identifying points where multiple entry reasons coincide.
In the explanations,more than 1,000 chartsare used.

Methods and Case Studies (PDF) ★GogoJungle AWARD2020 Winner★
https://www.gogojungle.co.jp/tools/indicators/11836
The above products include 301 PDF files. For a list of their PDF titles and related details, please refer to the article below.
About the 301 PDF files included with 【BODSOR・mBDSR】
https://www.gogojungle.co.jp/finance/navi/articles/34271
EURCAD 1-hour
In the 1-hour chart above,Support line(horizontal line) was temporarily broken below, then rose toward near this horizontal linemBDSR (filters: RCI26 and RCI52)sell signals appeared on the rebound, and afterward, the price steadily declined.
From this example,the trade method focusing on support-resistance turning pointsand theaffinity with mBDSR signalscan be seen clearly.
Indicator that shines in combination with RCI: 【BODSOR・mBDSR】
Methods and Case Studies (PDF) ★GogoJungle AWARD2020 Winner★
https://www.gogojungle.co.jp/tools/indicators/11836
The PDF file includes 301 documents (over 1,000 pages, over 350,000 characters in total).
Many of them are designed to logically link higher and lower timeframes using three RCI lines, then progressively examine the conditions across multiple lower timeframes, ultimately waiting for swing-buy or pullback sell timing (i.e., mBDSR signals) on the lower timeframesand summarizing such examples.
Also,there are many that emphasize identifying points where multiple entry reasons coincide.
In the explanations,more than 1,000 chartsare used.
× ![]()


