

From yesterday's EUR/JPY chart, the overbought/oversold signals: counter-trend signals at Bollinger Bands, head and shoulders pattern, and the mBDSR (RCI two-filter) pullback selling signal
0
In recent articles of Investment Navigator Plus,we focus on examples that demonstrate the strong compatibility between various trading methods and mBDSR signalsto help you understand.
EURJPY 4-hour chart
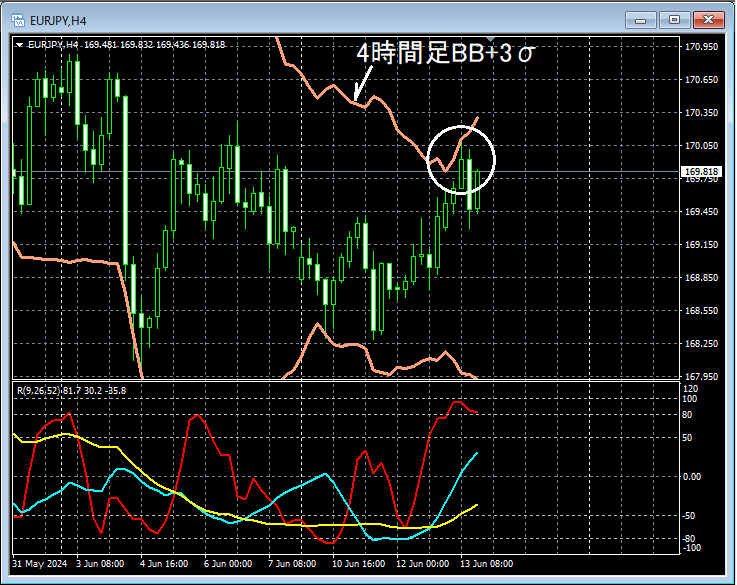
If you look at the area circled in white on the 4-hour chart above,the price has risen close to the 4-hour Bollinger Bands (+3σ)nearby. It is also necessary to consider higher timeframes, but that is omitted here. It wouldn’t be surprising if there is a slight pullback at this point.
EURJPY 1-minute chart
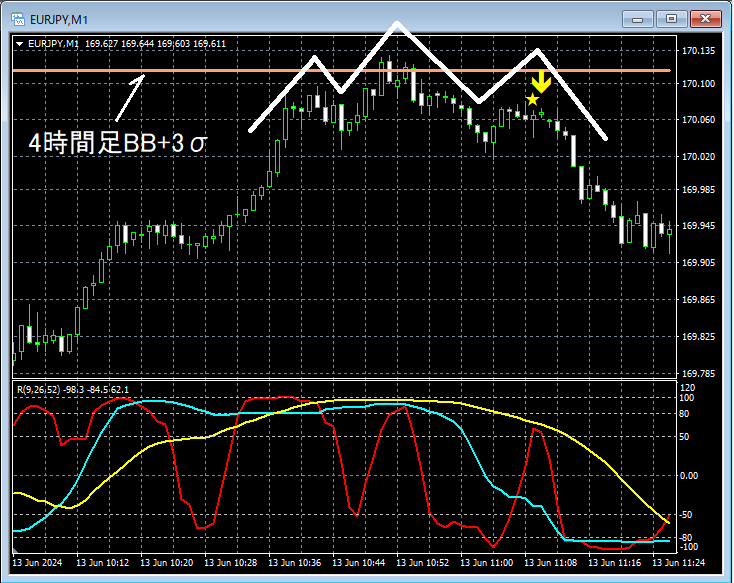
On the 1-minute chart above,the price rises toward the 4-hour Bollinger Bands (+3σ)and thenforming a head and shouldersthe price continues to fall steadily. As a result, at the right shoulder of thehead and shouldersthere isan mBDSR (filter: RCI26 and RCI52) pullback-selling signalilluminated.
From this example,a trading approach focused on Bollinger Bands and head-and-shoulders patternsandmBDSR signalsshow a strong compatibility.
EURJPY 4-hour chart
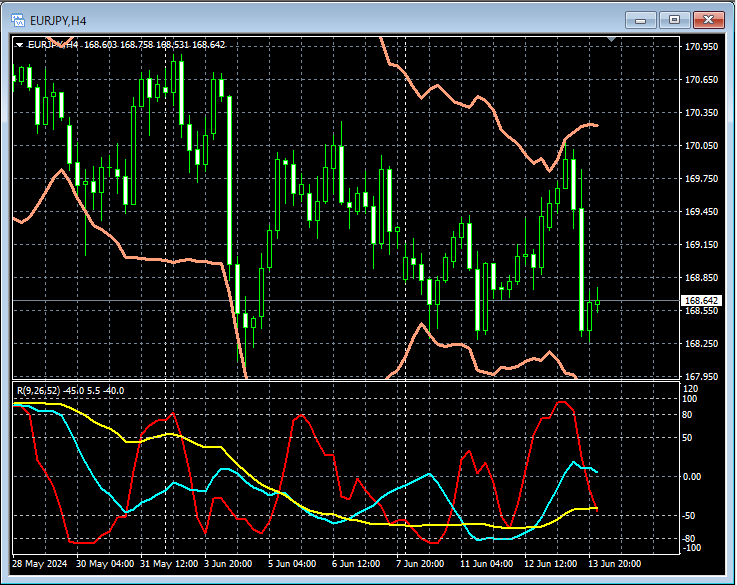
Moreover, when you look at the subsequent 4-hour chart, you can see that the price has fallen significantly.
Indicator that shines when combined with RCI: [BODSOR・mBDSR]
Methods・Case studies (PDF) ★GogoJungle AWARD2020 Winner★
https://www.gogojungle.co.jp/tools/indicators/11836
The PDF file includes 301 documents (over 1,000 pages in total, over 350,000 characters).
Many of them arecollections that logic-link higher and lower timeframes by using three RCI lines, progressively analyzing multiple lower-timeframe situations, and ultimately waiting for buy-the-dip or sell-the-rally timing on lower timeframes (i.e., mBDSR signals)..
Also,many are focused on identifying points where multiple entry justifications overlap..
The explanations usemore than 1,000 chartsin total.

× ![]()


